Example: spatial_connections
Note
You can launch an interactive, editable version of this example without installing any local files using the Binder service (although note that at some times this may be slow or fail to open):
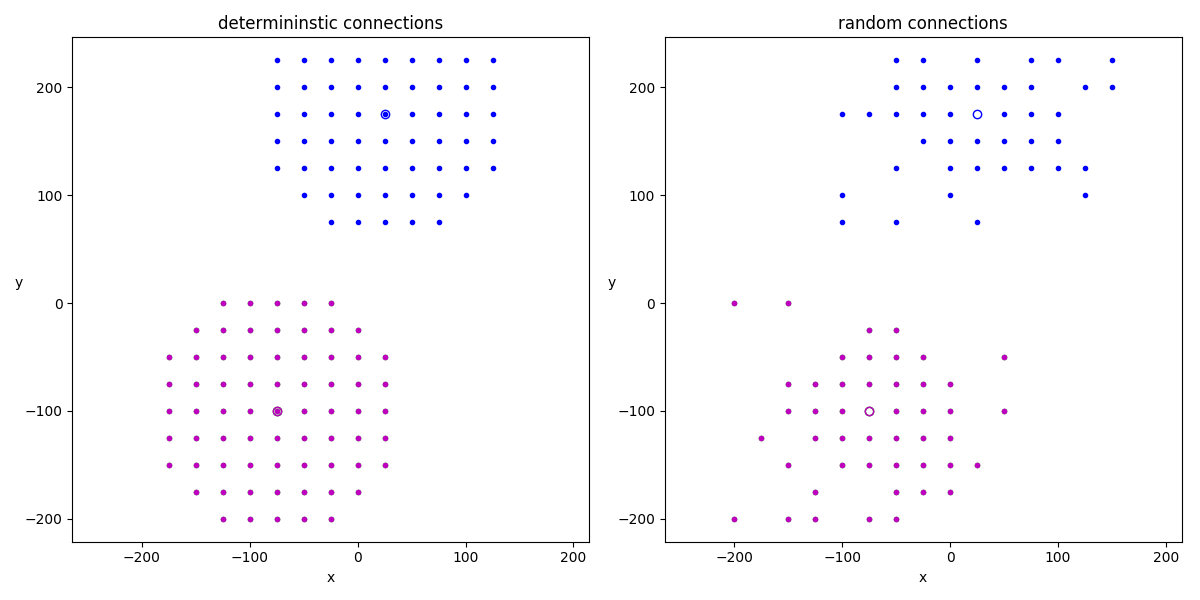
A simple example showing how string expressions can be used to implement spatial (deterministic or stochastic) connection patterns.
from brian2 import *

rows, cols = 20, 20
G = NeuronGroup(rows * cols, '''x : meter
                                y : meter''')
# initialize the grid positions
grid_dist = 25*umeter
G.x = '(i // rows) * grid_dist - rows/2.0 * grid_dist'
G.y = '(i % rows) * grid_dist - cols/2.0 * grid_dist'

# Deterministic connections
distance = 120*umeter
S_deterministic = Synapses(G, G)
S_deterministic.connect('sqrt((x_pre - x_post)**2 + (y_pre - y_post)**2) < distance')

# Random connections (no self-connections)
S_stochastic = Synapses(G, G)
S_stochastic.connect('i != j',
                     p='1.5 * exp(-((x_pre-x_post)**2 + (y_pre-y_post)**2)/(2*(60*umeter)**2))')

figure(figsize=(12, 6))

# Show the connections for some neurons in different colors
for color in ['g', 'b', 'm']:
    subplot(1, 2, 1)
    neuron_idx = np.random.randint(0, rows*cols)
    plot(G.x[neuron_idx] / umeter, G.y[neuron_idx] / umeter, 'o', mec=color,
         mfc='none')
    plot(G.x[S_deterministic.j[neuron_idx, :]] / umeter,
         G.y[S_deterministic.j[neuron_idx, :]] / umeter, color + '.')
    subplot(1, 2, 2)
    plot(G.x[neuron_idx] / umeter, G.y[neuron_idx] / umeter, 'o', mec=color,
         mfc='none')
    plot(G.x[S_stochastic.j[neuron_idx, :]] / umeter,
         G.y[S_stochastic.j[neuron_idx, :]] / umeter, color + '.')

for idx, t in enumerate(['determininstic connections',
                         'random connections']):
    subplot(1, 2, idx + 1)
    xlim((-rows/2.0 * grid_dist) / umeter, (rows/2.0 * grid_dist) / umeter)
    ylim((-cols/2.0 * grid_dist) / umeter, (cols/2.0 * grid_dist) / umeter)
    title(t)
    xlabel('x')
    ylabel('y', rotation='horizontal')
    axis('equal')

tight_layout()
show()