Example: Nicola_Clopath_2017
Note
You can launch an interactive, editable version of this example without installing any local files using the Binder service (although note that at some times this may be slow or fail to open):
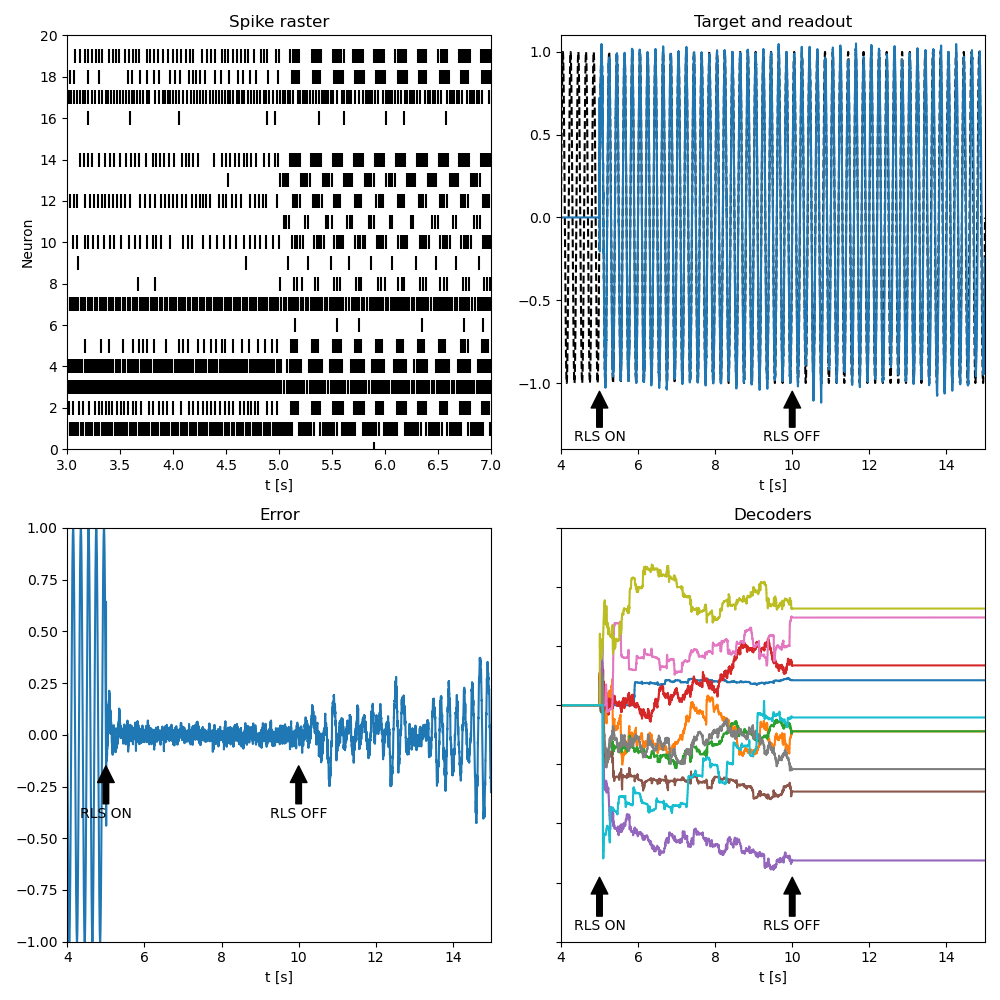
FORCE training of a Leaky IF model to mimic a sinusoid (5 Hz) oscillator
Nicola, W., Clopath, C. Supervised learning in spiking neural networks with FORCE training Nat Commun 8, 2208 (2017)
https://doi.org/10.1038/s41467-017-01827-3
Based on https://github.com/ModelDBRepository/190565/blob/master/CODE%20FOR%20FIGURE%202/LIFFORCESINE.m
Sebastian Schmitt, 2022
from brian2 import NeuronGroup, Synapses, StateMonitor, SpikeMonitor
from brian2 import run, defaultclock, network_operation
from brian2 import ms, second, Hz
import matplotlib.pyplot as plt
from matplotlib.ticker import MaxNLocator
import numpy as np

# set seed for reproducible figures
np.random.seed(1)

# decay time of synaptic kernal
td = 20*ms

# rise time of synaptic kernal
tr = 2*ms

# membrane time constant
tm = 10*ms

# refractory period
tref = 2*ms

# reset potential
vreset = -65

# peak/threshold potential
vpeak = -40

# bias
BIAS = vpeak

# integration time step
defaultclock.dt = 0.05*ms

# total duration of simulation
T = 15*second

# start of training
imin = 5*second

# end of training
icrit = 10*second

# interval of training
step = 2.5*ms

# feedback scale factor
Q = 10

# neuron-to-neuron connection scale factor
G = 0.04

# connection probability
p = 0.1

# number of neurons
N = 2000

# correlation weight matrix for RLMS
alpha = defaultclock.dt/second*0.1
Pinv = np.eye(N)*alpha

# Sinusoid oscillator
def zx(t):
    freq = 5*Hz
    return np.sin(2*np.pi*freq*t)

neurons = NeuronGroup(N,
                      """
                      dv/dt = (-v + BIAS + IPSC + E*z)/tm: 1 (unless refractory)
                      dIPSC/dt = -IPSC/tr + h : 1
                      dh/dt = -h/td : 1/second
                      dr/dt = -r/tr + hr : 1
                      dhr/dt = -hr/td : 1/second
                      BPhi : 1
                      z : 1 (shared)
                      E : 1
                      """,
                      method="euler",
                      threshold="v>=vpeak",
                      reset="v=vreset; hr += 1/(tr*td)*second",
                      refractory=tref)

# fixed feedback weights
neurons.E = (2*np.random.uniform(size=N)-1)*Q

# initial membrane voltage
neurons.v = vreset + np.random.uniform(size=N)*(30-vreset)

synapses = Synapses(neurons, neurons, "w : second", on_pre="h += w/(tr*td)")
synapses.connect()
omega = G*(np.random.normal(size=(N,N))*(np.random.uniform(size=(N,N))<p))/(np.sqrt(N)*p)
synapses.w = omega.flatten()*second

spikemon = SpikeMonitor(neurons[:20])
statemon_BPhi = StateMonitor(neurons, "BPhi", record=range(10))
statemon_z = StateMonitor(neurons, "z", record=[0])

# linear readout
@network_operation(dt=defaultclock.dt)
def readout(t):
    neurons.z = np.dot(neurons.BPhi, neurons.r)

# FORCE training
@network_operation(dt=step)
def train(t):
    global Pinv
    if t > imin and t < icrit:
        cd = Pinv@neurons.r
        err = neurons.z - zx(t)
        neurons.BPhi -= cd*err
        Pinv -= np.outer(cd,cd)/( 1 + np.dot(neurons.r, cd))

run(T, report="text")

fig, axes = plt.subplots(2,2, figsize=(10,10))
axes = axes.flatten()

axes[0].set_title("Spike raster")
axes[0].scatter(spikemon.t/second,spikemon.i, marker='|', linestyle="None", color="black", s=100)
axes[0].set_xlim((imin-2*second)/second, imin/second+2)
axes[0].set_ylim(0, len(spikemon.source))
axes[0].set_xlabel("t [s]")
axes[0].set_ylabel("Neuron")
axes[0].yaxis.set_major_locator(MaxNLocator(integer=True))

axes[1].plot(statemon_z.t/second, zx(statemon_z.t), linestyle='--', color='k')
axes[1].plot(statemon_z.t/second,statemon_z.z[0])

axes[1].set_title("Target and readout")
axes[1].annotate('RLS ON', xy=(imin/second, -1.05), xytext=(imin/second, -1.35),
            arrowprops=dict(facecolor='black', shrink=1), ha="center")
axes[1].annotate('RLS OFF', xy=(icrit/second, -1.05), xytext=(icrit/second, -1.35),
            arrowprops=dict(facecolor='black', shrink=1), ha="center")
axes[1].set_xlabel("t [s]")
axes[1].set_xlim((imin-1*second)/second, T/second)
axes[1].set_ylim(-1.4,1.1)

axes[2].set_title("Error")
axes[2].plot(statemon_z.t/second, statemon_z.z[0] - zx(statemon_z.t))
axes[2].annotate('RLS ON', xy=(imin/second, -0.15), xytext=(imin/second, -0.4),
            arrowprops=dict(facecolor='black', shrink=1), ha="center")
axes[2].annotate('RLS OFF', xy=(icrit/second, -0.15), xytext=(icrit/second, -0.4),
            arrowprops=dict(facecolor='black', shrink=1), ha="center")
axes[2].set_xlabel("t [s]")
axes[2].set_xlim((imin-1*second)/second, T/second)
axes[2].set_ylim(-1,1)

axes[3].set_title("Decoders")
for j in range(len(statemon_BPhi.record)):
    axes[3].plot(statemon_BPhi.t/second,statemon_BPhi.BPhi[j])
axes[3].set_xlim((imin-1*second)/second, T/second)
axes[3].set_xlabel("t [s]")
axes[3].set_ylim(-0.00020, 0.00015)
axes[3].set_yticklabels([])
axes[3].annotate('RLS ON', xy=(imin/second, -0.0001455), xytext=(imin/second, -0.00019),
            arrowprops=dict(facecolor='black', shrink=1), ha="center")
axes[3].annotate('RLS OFF', xy=(icrit/second, -0.0001455), xytext=(icrit/second, -0.00019),
            arrowprops=dict(facecolor='black', shrink=1), ha="center")

fig.tight_layout()