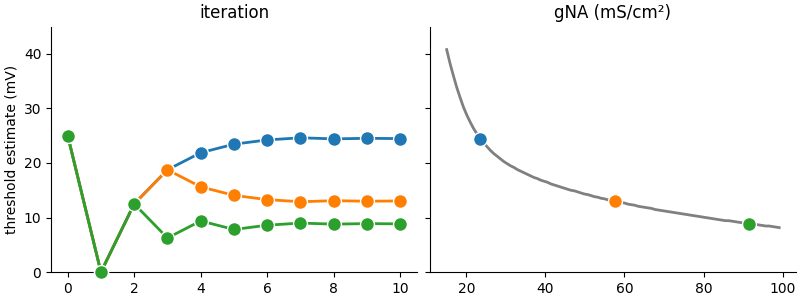
Example: example_3_bisection
Reproduces Figure 4B from Stimberg et al. (2019).
Same code as in the https://github.com/brian-team/brian2_paper_examples repository, but using matplotlib instead of Plotly for plotting.
Marcel Stimberg, Romain Brette, Dan FM Goodman (2019) Brian 2, an intuitive and efficient neural simulator eLife 8:e47314
https://doi.org/10.7554/eLife.47314
from brian2 import *

defaultclock.dt = 0.01*ms  # small time step for stiff equations

# Our model of the neuron is based on the classical model of from Hodgkin and Huxley (1952). Note that this is not
# actually a model of a neuron, but rather of a (space-clamped) axon. However, to avoid confusion with spatially
# extended models, we simply use the term "neuron" here. In this model, the membrane potential is shifted, i.e. the
# resting potential is at 0mV:
El = 10.613*mV
ENa = 115*mV
EK = -12*mV
gl = 0.3*msiemens/cm**2
gK = 36*msiemens/cm**2
gNa_max = 100*msiemens/cm**2
gNa_min = 15*msiemens/cm**2
C = 1*uF/cm**2

eqs = """
dv/dt = (gl * (El-v) + gNa * m**3 * h * (ENa-v) + gK * n**4 * (EK-v)) / C : volt
gNa : siemens/meter**2 (constant)
dm/dt = alpham * (1-m) - betam * m : 1
dn/dt = alphan * (1-n) - betan * n : 1
dh/dt = alphah * (1-h) - betah * h : 1
alpham = (0.1/mV) * 10*mV / exprel((-v+25*mV) / (10*mV))/ms : Hz
betam = 4 * exp(-v/(18*mV))/ms : Hz
alphah = 0.07 * exp(-v/(20*mV))/ms : Hz
betah = 1/(exp((-v+30*mV) / (10*mV)) + 1)/ms : Hz
alphan = (0.01/mV) * 10*mV / exprel((-v+10*mV) / (10*mV))/ms : Hz
betan = 0.125*exp(-v/(80*mV))/ms : Hz
"""

# We simulate 100 neurons at the same time, each of them having a density of sodium channels between 15 and 100 mS/cm²:
neurons = NeuronGroup(100, eqs, method="rk4", threshold="v>50*mV", reset="")
neurons.gNa = "gNa_min + (gNa_max - gNa_min)*1.0*i/N"

# We initialize the state variables to their resting state values, note that the values for $m$, $n$, $h$ depend on the
# values of $\alpha_m$, $\beta_m$, etc. which themselves depend on $v$. The order of the assignments ($v$ is
# initialized before $m$, $n$, and $h$) therefore matters, something that is naturally expressed by stating initial
# values as sequential assignments to the state variables. In a declarative approach, this would be potentially
# ambiguous.

neurons.v = 0*mV
neurons.m = "1/(1 + betam/alpham)"
neurons.n = "1/(1 + betan/alphan)"
neurons.h = "1/(1 + betah/alphah)"

# We record the spiking activity of the neurons and store the current network state so that we can later restore it and
# run another iteration of our experiment:

S = SpikeMonitor(neurons)
store()

# The algorithm we use here to find the voltage threshold is a simple bisection: we try to find the threshold voltage of
# a neuron by repeatedly testing values and increasing or decreasing these values depending on whether we observe a
# spike or not. By continously halving the size of the correction, we quickly converge to a precise estimate.
#
# We start with the same initial estimate for all segments, 25mV above the resting potential, and the same value for
# the size of the "correction step":

v0 = 25*mV*np.ones(len(neurons))
step = 25*mV

# For later visualization of how the estimates converged towards their final values, we also store the intermediate values of the estimates:
estimates = np.full((11, len(neurons)), np.nan)*mV
estimates[0, :] = v0

# We now run 10 iterations of our algorithm:

for i in range(10):
    print(".", end="")
    # Reset to the initial state
    restore()
    # Set the membrane potential to our threshold estimate and update the initial values of the gating variables
    neurons.v = v0
    # Note that we do not update the initial values of the gating variables to their steady state values with
    # respect to v, but rather to the resting potential.
    # Run the simulation for 20ms
    run(20*ms)
    print()
    # Decrease the estimates for neurons that spiked
    v0[S.count > 0] -= step
    # Increase the estimate for neurons that did not spike
    v0[S.count == 0] += step
    # Reduce step size and store current estimate
    step /= 2.0
    estimates[i + 1, :] = v0
print()

# After the 10 iteration steps, we plot the results:
plt.rcParams.update({'axes.spines.top': False,
                     'axes.spines.right': False})
fig, (ax1, ax2) = plt.subplots(1, 2, sharey=True, figsize=(8, 3), layout="constrained")

colors = ["#1f77b4", "#ff7f03", "#2ca02c"]
examples = [10, 50, 90]
for example, color in zip(examples, colors):
    ax1.plot(np.arange(11), estimates[:, example] / mV,
             "o-", mec='white', lw=2, color=color, clip_on=False, ms=10, zorder=100,
             label=f"gNA = {(neurons.gNa[example]/(mS/cm**2)):.1f}mS/cm$^2$")

ax2.plot(neurons.gNa/(mS/cm**2), v0/mV, color="gray", lw=2)

for idx, (example, color) in enumerate(zip(examples, colors)):
    ax2.plot([neurons.gNa[example]/(mS/cm**2)], [estimates[-1, example]/mV], "o", color=color, mec="white", ms=10,
             label=f"gNA = {(neurons.gNa[example]/(mS/cm**2)):.1f}mS/cm$^2$")

ax1.set(title="iteration", ylim=(0, 45), ylabel="threshold estimate (mV)")
ax2.set(title="gNA (mS/cm²)")

plt.show()
