Example: Izhikevich_2003
Note
You can launch an interactive, editable version of this example without installing any local files using the Binder service (although note that at some times this may be slow or fail to open):
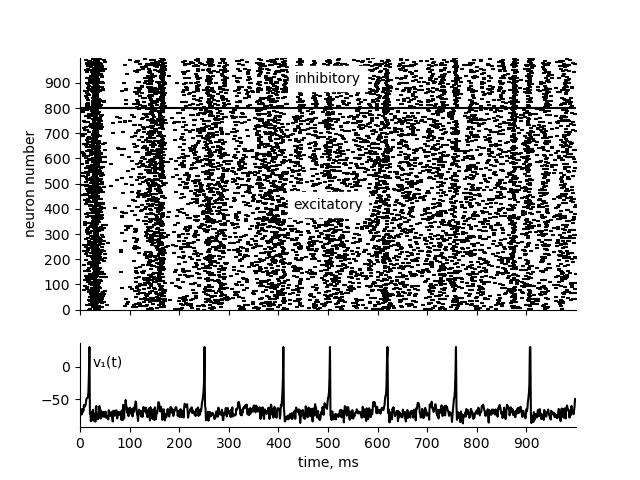
Fig. 3 of
Simple Model of Spiking Neurons IEEE Transactions on Neural Networks ( Volume: 14, Issue: 6, Nov. 2003) Eugene M. Izhikevich
based on net.m by Eugene M. Izhikevich (http://izhikevich.org/publications/spikes.htm)
Akif Erdem Sağtekin and Sebastian Schmitt, 2022
import matplotlib.pyplot as plt
import numpy as np

from brian2 import NeuronGroup, Synapses, SpikeMonitor, StateMonitor
from brian2 import ms, mV
from brian2 import defaultclock, run

tfinal = 1000 * ms
Ne = 800
Ni = 200

re = np.random.uniform(size=Ne)
ri = np.random.uniform(size=Ni)
weights = np.hstack(
    [
        0.5 * np.random.uniform(size=(Ne + Ni, Ne)),
        -np.random.uniform(size=(Ne + Ni, Ni)),
    ]
).T

defaultclock.dt = 1 * ms

eqs = """dv/dt = (0.04*v**2 + 5*v + 140 - u + I + I_noise )/ms : 1
         du/dt = (a*(b*v - u))/ms  : 1
         I : 1
         I_noise : 1
         a : 1
         b : 1
         c : 1
         d : 1
       """

N = NeuronGroup(Ne + Ni, eqs, threshold="v>=30", reset="v=c; u+=d", method="euler")
N.v = -65

N_exc = N[:Ne]
N_inh = N[Ne:]

spikemon = SpikeMonitor(N)
statemon = StateMonitor(N, 'v', record=0, when='after_thresholds')
N_exc.a = 0.02
N_exc.b = 0.2
N_exc.c = -65 + 15 * re**2
N_exc.d = 8 - 6 * re**2

N_inh.a = 0.02 + 0.08 * ri
N_inh.b = 0.25 - 0.05 * ri
N_inh.c = -65
N_inh.d = 2

N_exc.u = "b*v"
N_inh.u = "b*v"

S = Synapses(
    N,
    N,
    "w : 1",
    on_pre={"up": "I += w", "down": "I -= w"},
    delay={"up": 0 * ms, "down": 1 * ms},
)
S.connect()
S.w[:] = weights.flatten()

N_exc.run_regularly("I_noise = 5*randn()", dt=1 * ms)
N_inh.run_regularly("I_noise = 2*randn()", dt=1 * ms)

run(tfinal)

fig, (ax, ax_voltage) = plt.subplots(2, 1, sharex=True,
                                     gridspec_kw={'height_ratios': (3, 1)})

ax.scatter(spikemon.t / ms, spikemon.i[:], marker="_", color="k", s=10)
ax.set_xlim(0, tfinal / ms)
ax.set_ylim(0, len(N))
ax.set_ylabel("neuron number")
ax.set_yticks(np.arange(0, len(N), 100))
ax.spines['right'].set_visible(False)
ax.spines['top'].set_visible(False)
ax.axhline(Ne, color="k")
ax.text(500, 900, 'inhibitory', backgroundcolor='w', color='k', ha='center')
ax.text(500, 400, 'excitatory', backgroundcolor='w', color='k', ha='center')

ax_voltage.plot(statemon.t / ms, np.clip(statemon.v[0], -np.inf, 30),
               color='k')
ax_voltage.text(25, 0, 'v₁(t)')
ax_voltage.set_xticks(np.arange(0, tfinal / ms, 100))
ax_voltage.spines['right'].set_visible(False)
ax_voltage.spines['top'].set_visible(False)
ax_voltage.set_xlabel("time, ms")

plt.show()