Example: nonlinear
Note
You can launch an interactive, editable version of this example without installing any local files using the Binder service (although note that at some times this may be slow or fail to open):
NMDA synapses.
from brian2 import *
a = 1 / (10*ms)
b = 1 / (10*ms)
c = 1 / (10*ms)
neuron_input = NeuronGroup(2, 'dv/dt = 1/(10*ms) : 1', threshold='v>1', reset='v = 0',
method='euler')
neurons = NeuronGroup(1, """dv/dt = (g-v)/(10*ms) : 1
g : 1""", method='exact')
S = Synapses(neuron_input, neurons, '''
dg_syn/dt = -a*g_syn+b*x*(1-g_syn) : 1 (clock-driven)
g_post = g_syn : 1 (summed)
dx/dt=-c*x : 1 (clock-driven)
w : 1 # synaptic weight
''', on_pre='x += w') # NMDA synapses
S.connect()
S.w = [1., 10.]
neuron_input.v = [0., 0.5]
M = StateMonitor(S, 'g',
# If not using standalone mode, this could also simply be
# record=True
record=np.arange(len(neuron_input)*len(neurons)))
Mn = StateMonitor(neurons, 'g', record=0)
run(1000*ms)
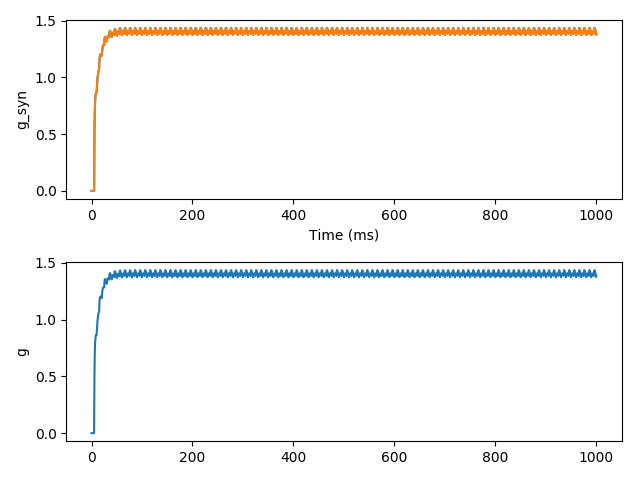
subplot(2, 1, 1)
plot(M.t/ms, M.g.T)
xlabel('Time (ms)')
ylabel('g_syn')
subplot(2, 1, 2)
plot(Mn.t/ms, Mn[0].g)
ylabel('Time (ms)')
ylabel('g')
tight_layout()
show()