Example: IF_curve_Hodgkin_Huxley
Note
You can launch an interactive, editable version of this example without installing any local files using the Binder service (although note that at some times this may be slow or fail to open):
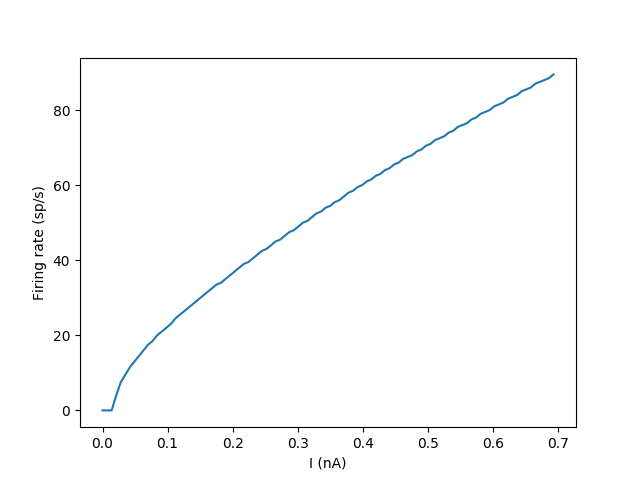
Input-Frequency curve of a HH model.
Network: 100 unconnected Hodgin-Huxley neurons with an input current I. The input is set differently for each neuron.
This simulation should use exponential Euler integration.
from brian2 import *

num_neurons = 100
duration = 2*second

# Parameters
area = 20000*umetre**2
Cm = 1*ufarad*cm**-2 * area
gl = 5e-5*siemens*cm**-2 * area
El = -65*mV
EK = -90*mV
ENa = 50*mV
g_na = 100*msiemens*cm**-2 * area
g_kd = 30*msiemens*cm**-2 * area
VT = -63*mV

# The model
eqs = Equations('''
dv/dt = (gl*(El-v) - g_na*(m*m*m)*h*(v-ENa) - g_kd*(n*n*n*n)*(v-EK) + I)/Cm : volt
dm/dt = 0.32*(mV**-1)*4*mV/exprel((13.*mV-v+VT)/(4*mV))/ms*(1-m)-0.28*(mV**-1)*5*mV/exprel((v-VT-40.*mV)/(5*mV))/ms*m : 1
dn/dt = 0.032*(mV**-1)*5*mV/exprel((15.*mV-v+VT)/(5*mV))/ms*(1.-n)-.5*exp((10.*mV-v+VT)/(40.*mV))/ms*n : 1
dh/dt = 0.128*exp((17.*mV-v+VT)/(18.*mV))/ms*(1.-h)-4./(1+exp((40.*mV-v+VT)/(5.*mV)))/ms*h : 1
I : amp
''')
# Threshold and refractoriness are only used for spike counting
group = NeuronGroup(num_neurons, eqs,
                    threshold='v > -40*mV',
                    refractory='v > -40*mV',
                    method='exponential_euler')
group.v = El
group.I = '0.7*nA * i / num_neurons'

monitor = SpikeMonitor(group)

run(duration)

plot(group.I/nA, monitor.count / duration)
xlabel('I (nA)')
ylabel('Firing rate (sp/s)')
show()