Example: licklider
Note
You can launch an interactive, editable version of this example without installing any local files using the Binder service (although note that at some times this may be slow or fail to open):
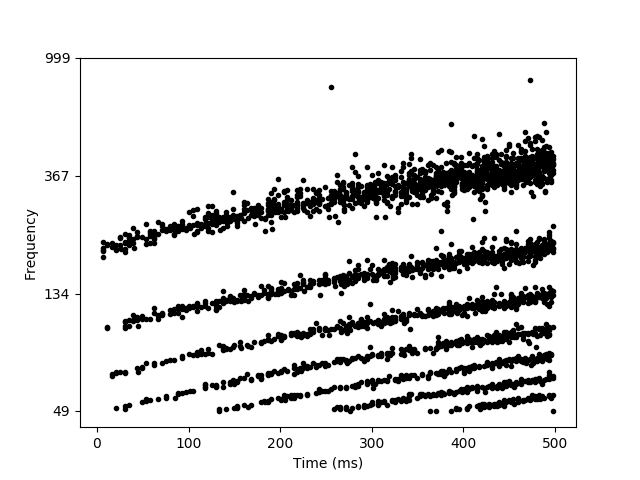
Spike-based adaptation of Licklider’s model of pitch processing (autocorrelation with delay lines) with phase locking.
from brian2 import *

defaultclock.dt = .02 * ms

# Ear and sound
max_delay = 20*ms # 50 Hz
tau_ear = 1*ms
sigma_ear = 0.0
eqs_ear = '''
dx/dt = (sound-x)/tau_ear+0.1*(2./tau_ear)**.5*xi : 1 (unless refractory)
sound = 5*sin(2*pi*frequency*t)**3 : 1 # nonlinear distortion
#sound = 5*(sin(4*pi*frequency*t)+.5*sin(6*pi*frequency*t)) : 1 # missing fundamental
frequency = (200+200*t*Hz)*Hz : Hz # increasing pitch
'''
receptors = NeuronGroup(2, eqs_ear, threshold='x>1', reset='x=0',
                        refractory=2*ms, method='euler')
# Coincidence detectors
min_freq = 50*Hz
max_freq = 1000*Hz
num_neurons = 300
tau = 1*ms
sigma = .1
eqs_neurons = '''
dv/dt = -v/tau+sigma*(2./tau)**.5*xi : 1
'''

neurons = NeuronGroup(num_neurons, eqs_neurons, threshold='v>1', reset='v=0',
                      method='euler')

synapses = Synapses(receptors, neurons, on_pre='v += 0.5')
synapses.connect()
synapses.delay = 'i*1.0/exp(log(min_freq/Hz)+(j*1.0/(num_neurons-1))*log(max_freq/min_freq))*second'

spikes = SpikeMonitor(neurons)

run(500*ms)
plot(spikes.t/ms, spikes.i, '.k')
xlabel('Time (ms)')
ylabel('Frequency')
yticks([0, 99, 199, 299],
       array(1. / synapses.delay[1, [0, 99, 199, 299]], dtype=int))
show()