Example: jeffress
Note
You can launch an interactive, editable version of this example without installing any local files using the Binder service (although note that at some times this may be slow or fail to open):
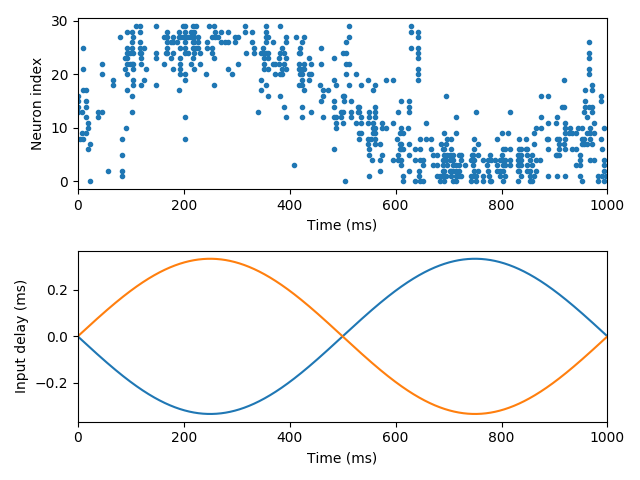
Jeffress model, adapted with spiking neuron models. A sound source (white noise) is moving around the head. Delay differences between the two ears are used to determine the azimuth of the source. Delays are mapped to a neural place code using delay lines (each neuron receives input from both ears, with different delays).
from brian2 import *

defaultclock.dt = .02*ms

# Sound
sound = TimedArray(10 * randn(50000), dt=defaultclock.dt) # white noise

# Ears and sound motion around the head (constant angular speed)
sound_speed = 300*metre/second
interaural_distance = 20*cm # big head!
max_delay = interaural_distance / sound_speed
print("Maximum interaural delay: %s" % max_delay)
angular_speed = 2 * pi / second # 1 turn/second
tau_ear = 1*ms
sigma_ear = .1
eqs_ears = '''
dx/dt = (sound(t-delay)-x)/tau_ear+sigma_ear*(2./tau_ear)**.5*xi : 1 (unless refractory)
delay = distance*sin(theta) : second
distance : second # distance to the centre of the head in time units
dtheta/dt = angular_speed : radian
'''
ears = NeuronGroup(2, eqs_ears, threshold='x>1', reset='x = 0',
                   refractory=2.5*ms, name='ears', method='euler')
ears.distance = [-.5 * max_delay, .5 * max_delay]
traces = StateMonitor(ears, 'delay', record=True)
# Coincidence detectors
num_neurons = 30
tau = 1*ms
sigma = .1
eqs_neurons = '''
dv/dt = -v / tau + sigma * (2 / tau)**.5 * xi : 1
'''
neurons = NeuronGroup(num_neurons, eqs_neurons, threshold='v>1',
                      reset='v = 0', name='neurons', method='euler')

synapses = Synapses(ears, neurons, on_pre='v += .5')
synapses.connect()

synapses.delay['i==0'] = '(1.0*j)/(num_neurons-1)*1.1*max_delay'
synapses.delay['i==1'] = '(1.0*(num_neurons-j-1))/(num_neurons-1)*1.1*max_delay'

spikes = SpikeMonitor(neurons)

run(1000*ms)

# Plot the results
i, t = spikes.it
subplot(2, 1, 1)
plot(t/ms, i, '.')
xlabel('Time (ms)')
ylabel('Neuron index')
xlim(0, 1000)
subplot(2, 1, 2)
plot(traces.t/ms, traces.delay.T/ms)
xlabel('Time (ms)')
ylabel('Input delay (ms)')
xlim(0, 1000)
tight_layout()
show()