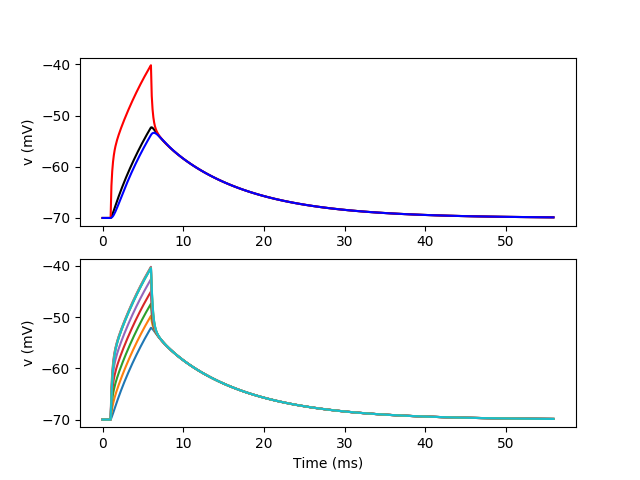
Example: bipolar_cell
A pseudo MSO neuron, with two dendrites and one axon (fake geometry).
from brian2 import *

# Morphology
morpho = Soma(30*um)
morpho.axon = Cylinder(diameter=1*um, length=300*um, n=100)
morpho.L = Cylinder(diameter=1*um, length=100*um, n=50)
morpho.R = Cylinder(diameter=1*um, length=150*um, n=50)

# Passive channels
gL = 1e-4*siemens/cm**2
EL = -70*mV
eqs='''
Im = gL * (EL - v) : amp/meter**2
I : amp (point current)
'''

neuron = SpatialNeuron(morphology=morpho, model=eqs,
                       Cm=1*uF/cm**2, Ri=100*ohm*cm, method='exponential_euler')
neuron.v = EL
neuron.I = 0*amp

# Monitors
mon_soma = StateMonitor(neuron, 'v', record=[0])
mon_L = StateMonitor(neuron.L, 'v', record=True)
mon_R = StateMonitor(neuron, 'v', record=morpho.R[75*um])

run(1*ms)
neuron.I[morpho.L[50*um]] = 0.2*nA  # injecting in the left dendrite
run(5*ms)
neuron.I = 0*amp
run(50*ms, report='text')

subplot(211)
plot(mon_L.t/ms, mon_soma[0].v/mV, 'k')
plot(mon_L.t/ms, mon_L[morpho.L[50*um]].v/mV, 'r')
plot(mon_L.t/ms, mon_R[morpho.R[75*um]].v/mV, 'b')
ylabel('v (mV)')
subplot(212)
for x in linspace(0*um, 100*um, 10, endpoint=False):
    plot(mon_L.t/ms, mon_L[morpho.L[x]].v/mV)
xlabel('Time (ms)')
ylabel('v (mV)')
show()
