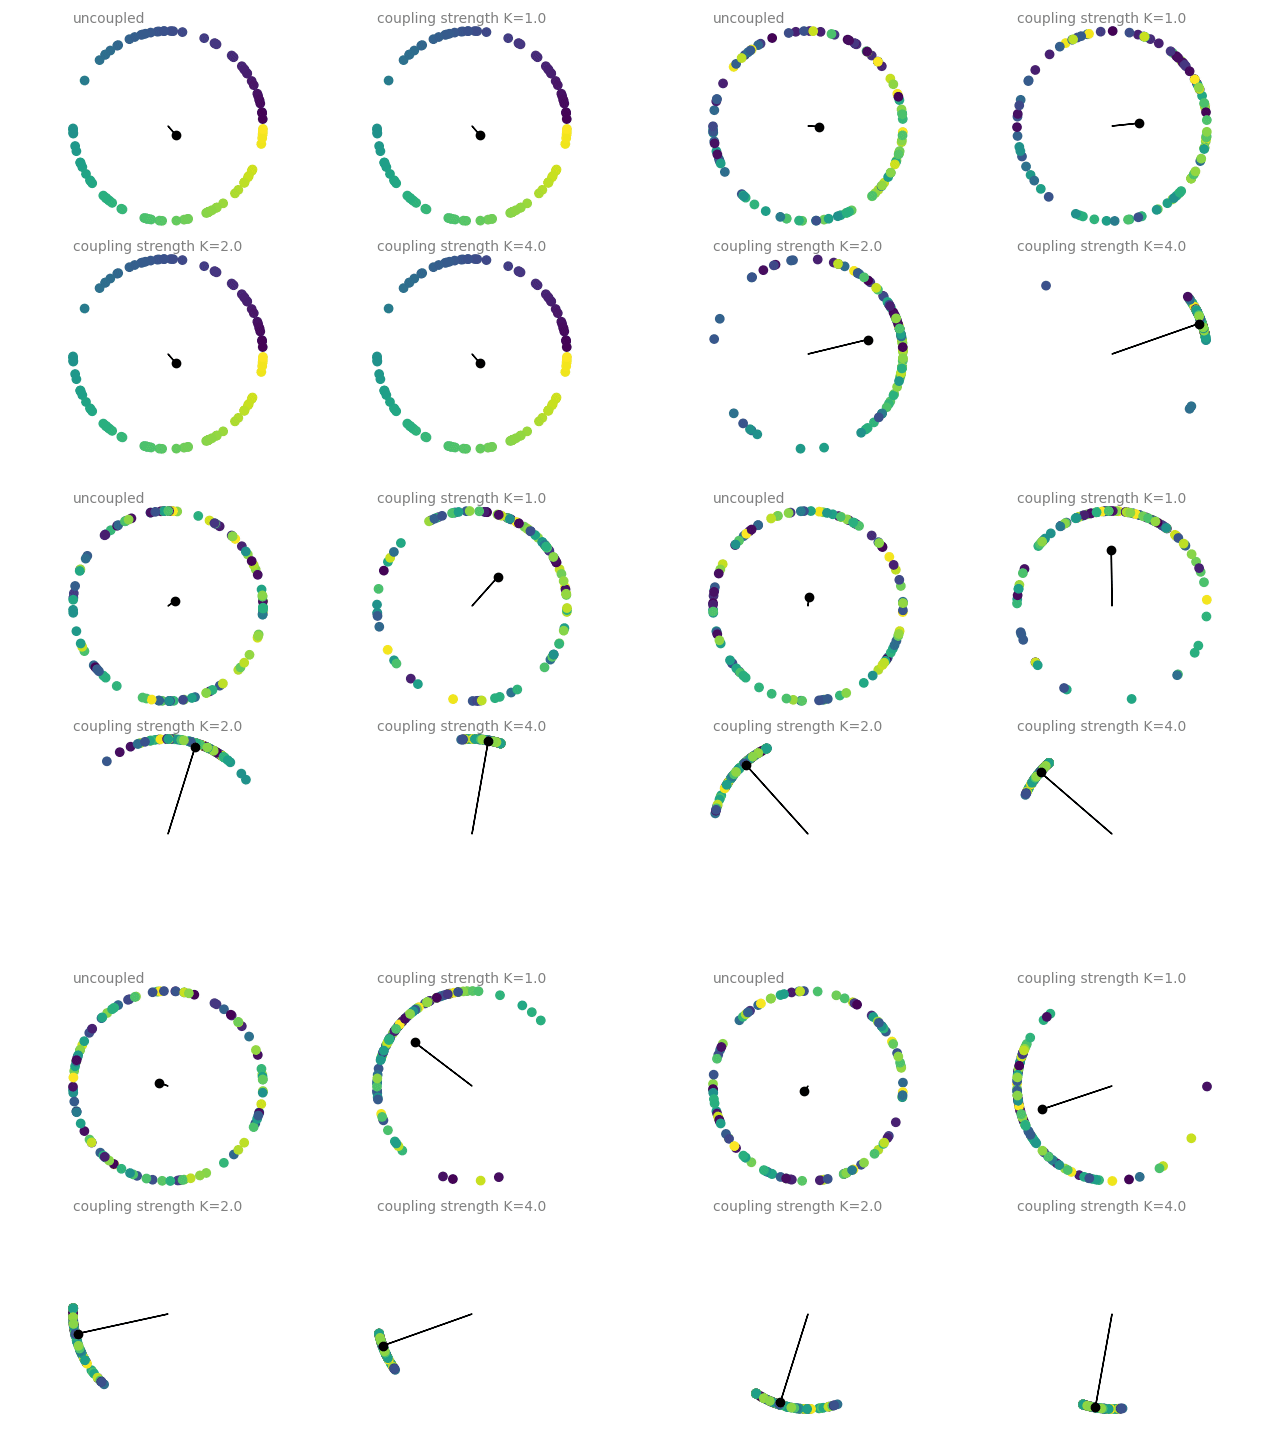
Example: coupled_oscillators
Coupled oscillators, following the Kuramoto model. The current state of an oscillator is given by its phase \(\Theta\), which follows
\[\frac{d\Theta_i}{dt} = \omega_i + \frac{K}{N}\sum_j sin(\Theta_j - \Theta_i)\]
where \(\omega_i\) is the intrinsic frequency of each oscillator, \(K\) is the coupling strength, and the sum is over all oscillators (all-to-all coupling).
The plots show a dot on the unit circle denoting the phase of each neuron (with the color representing the initial phase at the start of the simulation). The black dot and line show the average phase (dot) and the phase coherence (length of the line). The simulations are run four times with different coupling strengths \(K\), each simulation starting from the same initial phase distribution.
https://en.wikipedia.org/wiki/Kuramoto_model
import matplotlib.animation as animation

from brian2 import *
from brian2.core.functions import timestep

### global parameters
N = 100
defaultclock.dt = 1*ms


### simulation code
def run_sim(K, random_seed=214040893):
    seed(random_seed)

    eqs = '''
    dTheta/dt = omega + K/N*coupling : radian
    omega : radian/second (constant) # intrinsic frequency
    coupling : 1
    '''

    oscillators = NeuronGroup(N, eqs, method='euler')
    oscillators.Theta = 'rand()*2*pi'  # random initial phase
    oscillators.omega = 'clip(0.5 + randn()*0.5, 0, inf)*radian/second'  # 𝒩(0.5, 0.5)

    connections = Synapses(oscillators, oscillators,
                        'coupling_post = sin(Theta_pre - Theta_post) : 1 (summed)')
    connections.connect()  # all-to-all

    mon = StateMonitor(oscillators, 'Theta', record=True)
    run(10*second)
    return mon.Theta[:]

### Create animated plots
frame_delay = 40*ms

# Helper functions
def to_x_y(phases):
    return np.cos(phases), np.sin(phases)

def calc_coherence_and_phase(x, y):
    phi = np.arctan2(np.sum(y), np.sum(x))
    r = np.sqrt(np.sum(x)**2 + np.sum(y)**2)/N
    return r, phi

# Plot an animation with the phase of each oscillator and the average phase
def do_animation(fig, axes, K_values, theta_values):
    '''
    Makes animated subplots in the given ``axes``, where each ``theta_values`` entry
    is the full recording of ``Theta`` from the monitor.
    '''
    artists = []
    for ax, K, Theta in zip(axes, K_values, theta_values):
        x, y = to_x_y(Theta.T[0])
        dots = ax.scatter(x, y, c=Theta.T[0])
        r, phi = calc_coherence_and_phase(x, y)
        arrow = ax.arrow(0, 0, r*np.cos(phi), r*np.sin(phi), color='black')
        mean_dot, = ax.plot(r*np.cos(phi), r*np.sin(phi), 'o', color='black')
        if abs(K) > 0:
            title = f"coupling strength K={K:.1f}"
        else:
            title = "uncoupled"
        ax.text(-1., 1.05, title, color='gray', va='bottom')
        ax.set_aspect('equal')
        ax.set_axis_off()
        ax.set(xlim=(-1.2, 1.2), ylim=(-1.2, 1.2))
        artists.append((dots, arrow, mean_dot))


    def update(frame_number):
        updated_artists = []
        for (dots, arrow, mean_dot), K, Theta in zip(artists, K_values, theta_values):
            t = frame_delay*frame_number
            ts = timestep(t, defaultclock.dt)
            x, y = to_x_y(Theta.T[ts])
            dots.set_offsets(np.vstack([x, y]).T)
            r, phi = calc_coherence_and_phase(x, y)
            arrow.set_data(dx=r*np.cos(phi), dy=r*np.sin(phi))
            mean_dot.set_data(r*np.cos(phi), r*np.sin(phi))
            updated_artists.extend([dots, arrow, mean_dot])
        return updated_artists

    ani = animation.FuncAnimation(fig, update, frames=int(magic_network.t/frame_delay),
                                interval=20, blit=True)

    return ani

if __name__ == '__main__':
    fig, axs = plt.subplots(2, 2)
    # Manual adjustments instead of layout='tight', to avoid jumps in saved animation
    fig.subplots_adjust(left=0.025, bottom=0.025, right=0.975,  top=0.975,
                        wspace=0, hspace=0)
    K_values = [0, 1, 2, 4]
    theta_values = []
    for K in K_values:
        print(f"Running simulation for K={K:.1f}")
        theta_values.append( run_sim(K/second))
    ani = do_animation(fig, axs.flat, K_values, theta_values)

    plt.show()
