Example: Diesmann_et_al_1999
Note
You can launch an interactive, editable version of this example without installing any local files using the Binder service (although note that at some times this may be slow or fail to open):
Synfire chains
M. Diesmann et al. (1999). Stable propagation of synchronous spiking in cortical neural networks. Nature 402, 529-533.
from brian2 import *
duration = 100*ms
# Neuron model parameters
Vr = -70*mV
Vt = -55*mV
taum = 10*ms
taupsp = 0.325*ms
weight = 4.86*mV
# Neuron model
eqs = Equations('''
dV/dt = (-(V-Vr)+x)*(1./taum) : volt
dx/dt = (-x+y)*(1./taupsp) : volt
dy/dt = -y*(1./taupsp)+25.27*mV/ms+
(39.24*mV/ms**0.5)*xi : volt
''')
# Neuron groups
n_groups = 10
group_size = 100
P = NeuronGroup(N=n_groups*group_size, model=eqs,
threshold='V>Vt', reset='V=Vr', refractory=1*ms,
method='euler')
Pinput = SpikeGeneratorGroup(85, np.arange(85),
np.random.randn(85)*1*ms + 50*ms)
# The network structure
S = Synapses(P, P, on_pre='y+=weight')
S.connect(j='k for k in range((int(i/group_size)+1)*group_size, (int(i/group_size)+2)*group_size) '
'if i<N_pre-group_size')
Sinput = Synapses(Pinput, P[:group_size], on_pre='y+=weight')
Sinput.connect()
# Record the spikes
Mgp = SpikeMonitor(P)
Minput = SpikeMonitor(Pinput)
# Setup the network, and run it
P.V = 'Vr + rand() * (Vt - Vr)'
run(duration)
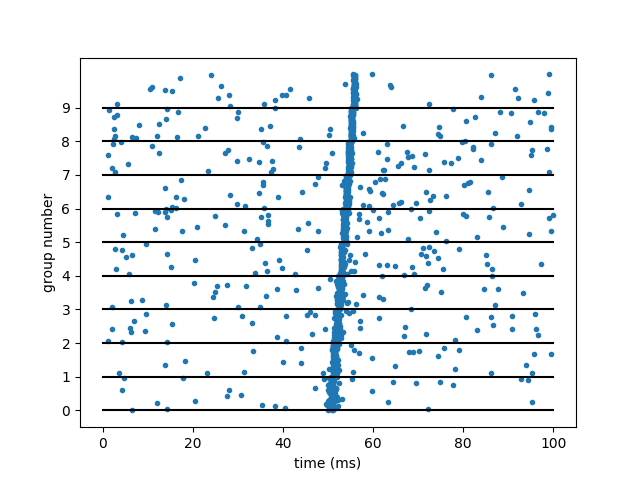
plot(Mgp.t/ms, 1.0*Mgp.i/group_size, '.')
plot([0, duration/ms], np.arange(n_groups).repeat(2).reshape(-1, 2).T, 'k-')
ylabel('group number')
yticks(np.arange(n_groups))
xlabel('time (ms)')
show()