Example: Fig1
Note
You can launch an interactive, editable version of this example without installing any local files using the Binder service (although note that at some times this may be slow or fail to open):
Brette R (2013). Sharpness of spike initiation in neurons explained by compartmentalization. PLoS Comp Biol, doi: 10.1371/journal.pcbi.1003338.
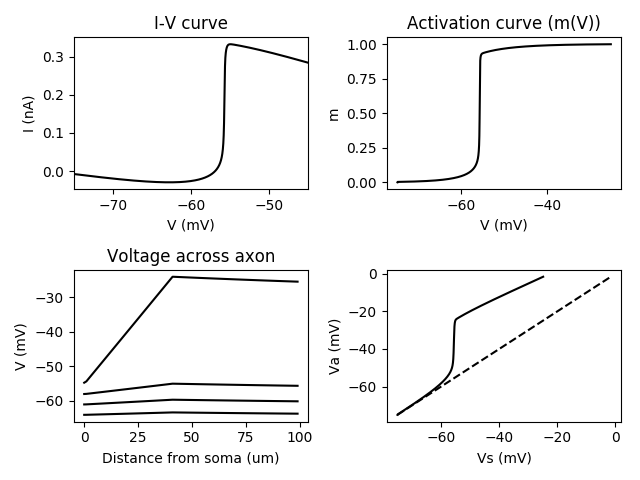
Fig 1C-E. Somatic voltage-clamp in a ball-and-stick model with Na channels at a particular location.
from brian2 import *
from params import *

defaultclock.dt = 0.025*ms

# Morphology
morpho = Soma(50*um)  # chosen for a target Rm
morpho.axon = Cylinder(diameter=1*um, length=300*um, n=300)

location = 40*um # where Na channels are placed
duration = 500*ms

# Channels
eqs='''
Im = gL*(EL - v) + gclamp*(vc - v) + gNa*m*(ENa - v) : amp/meter**2
dm/dt = (minf - m) / taum: 1  # simplified Na channel
minf = 1 / (1 + exp((va - v) / ka)) : 1
gclamp : siemens/meter**2
gNa : siemens/meter**2
vc = EL + 50*mV * t/duration : volt (shared)  # Voltage clamp with a ramping voltage command
'''

neuron = SpatialNeuron(morphology=morpho, model=eqs, Cm=Cm, Ri=Ri)
compartment = morpho.axon[location]
neuron.v = EL
neuron.gclamp[0] = gL*500
neuron.gNa[compartment] = gNa_0/neuron.area[compartment]

# Monitors
mon = StateMonitor(neuron, ['v', 'vc', 'm'], record=True)

run(duration, report='text')

subplot(221)
plot(mon[0].vc/mV,
     -((mon[0].vc - mon[0].v)*(neuron.gclamp[0]))*neuron.area[0]/nA, 'k')
xlabel('V (mV)')
ylabel('I (nA)')
xlim(-75, -45)
title('I-V curve')

subplot(222)
plot(mon[0].vc/mV, mon[compartment].m, 'k')
xlabel('V (mV)')
ylabel('m')
title('Activation curve (m(V))')

subplot(223)
# Number of simulation time steps for each volt increment in the voltage-clamp
dt_per_volt = len(mon.t)/(50*mV)
for v in [-64*mV, -61*mV, -58*mV, -55*mV]:
    plot(mon.v[:100, int(dt_per_volt*(v - EL))]/mV, 'k')
xlabel('Distance from soma (um)')
ylabel('V (mV)')
title('Voltage across axon')

subplot(224)
plot(mon[compartment].v/mV, mon[compartment].v/mV, 'k--')  # Diagonal
plot(mon[0].v/mV, mon[compartment].v/mV, 'k')
xlabel('Vs (mV)')
ylabel('Va (mV)')
tight_layout()
show()