Example: adaptive_threshold
Note
You can launch an interactive, editable version of this example without installing any local files using the Binder service (although note that at some times this may be slow or fail to open):
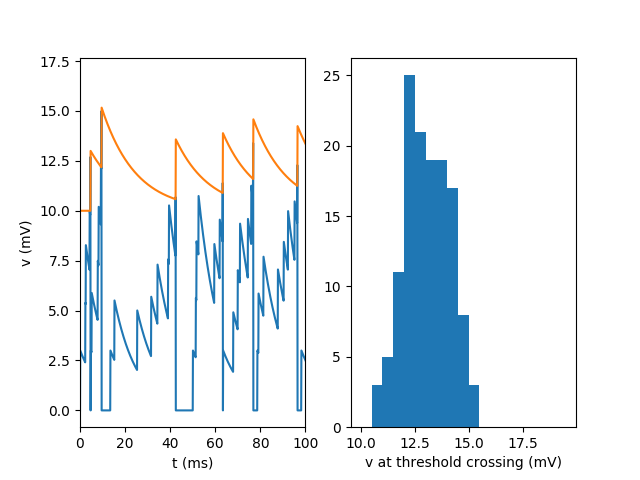
A model with adaptive threshold (increases with each spike)
from brian2 import *

eqs = '''
dv/dt = -v/(10*ms) : volt
dvt/dt = (10*mV-vt)/(15*ms) : volt
'''

reset = '''
v = 0*mV
vt += 3*mV
'''

IF = NeuronGroup(1, model=eqs, reset=reset, threshold='v>vt',
                 method='exact')
IF.vt = 10*mV
PG = PoissonGroup(1, 500 * Hz)

C = Synapses(PG, IF, on_pre='v += 3*mV')
C.connect()

Mv = StateMonitor(IF, 'v', record=True)
Mvt = StateMonitor(IF, 'vt', record=True)
# Record the value of v when the threshold is crossed
M_crossings = SpikeMonitor(IF, variables='v')
run(2*second, report='text')

subplot(1, 2, 1)
plot(Mv.t / ms, Mv[0].v / mV)
plot(Mvt.t / ms, Mvt[0].vt / mV)
ylabel('v (mV)')
xlabel('t (ms)')
# zoom in on the first 100ms
xlim(0, 100)
subplot(1, 2, 2)
hist(M_crossings.v / mV, bins=np.arange(10, 20, 0.5))
xlabel('v at threshold crossing (mV)')
show()