Example: Rossant_et_al_2011bis
Note
You can launch an interactive, editable version of this example without installing any local files using the Binder service (although note that at some times this may be slow or fail to open):
Distributed synchrony example
Fig. 14 from:
Rossant C, Leijon S, Magnusson AK, Brette R (2011). “Sensitivity of noisy neurons to coincident inputs”. Journal of Neuroscience, 31(47).
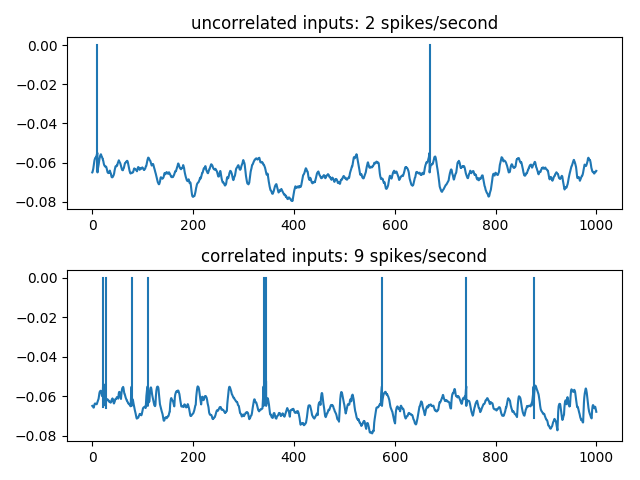
5000 independent E/I Poisson inputs are injected into a leaky integrate-and-fire neuron. Synchronous events, following an independent Poisson process at 40 Hz, are considered, where 15 E Poisson spikes are randomly shifted to be synchronous at those events. The output firing rate is then significantly higher, showing that the spike timing of less than 1% of the excitatory synapses have an important impact on the postsynaptic firing.
from brian2 import *

# neuron parameters
theta = -55*mV
El = -65*mV
vmean = -65*mV
taum = 5*ms
taue = 3*ms
taui = 10*ms
eqs = Equations("""
                dv/dt  = (ge+gi-(v-El))/taum : volt
                dge/dt = -ge/taue : volt
                dgi/dt = -gi/taui : volt
                """)

# input parameters
p = 15
ne = 4000
ni = 1000
lambdac = 40*Hz
lambdae = lambdai = 1*Hz

# synapse parameters
we = .5*mV/(taum/taue)**(taum/(taue-taum))
wi = (vmean-El-lambdae*ne*we*taue)/(lambdae*ni*taui)

# NeuronGroup definition
group = NeuronGroup(N=2, model=eqs, reset='v = El',
                    threshold='v>theta',
                    refractory=5*ms, method='exact')
group.v = El
group.ge = group.gi = 0

# independent E/I Poisson inputs
p1 = PoissonInput(group[0:1], 'ge', N=ne, rate=lambdae, weight=we)
p2 = PoissonInput(group[0:1], 'gi', N=ni, rate=lambdai, weight=wi)

# independent E/I Poisson inputs + synchronous E events
p3 = PoissonInput(group[1:], 'ge', N=ne, rate=lambdae-(p*1.0/ne)*lambdac, weight=we)
p4 = PoissonInput(group[1:], 'gi', N=ni, rate=lambdai, weight=wi)
p5 = PoissonInput(group[1:], 'ge', N=1, rate=lambdac, weight=p*we)

# run the simulation
M = SpikeMonitor(group)
SM = StateMonitor(group, 'v', record=True)
BrianLogger.log_level_info()
run(1*second)
# plot trace and spikes
for i in [0, 1]:
    spikes = (M.t[M.i == i] - defaultclock.dt)/ms
    val = SM[i].v
    subplot(2, 1, i+1)
    plot(SM.t/ms, val)
    plot(tile(spikes, (2, 1)),
         vstack((val[array(spikes, dtype=int)],
                 zeros(len(spikes)))), 'C0')
    title("%s: %d spikes/second" % (["uncorrelated inputs", "correlated inputs"][i],
                                    M.count[i]))
tight_layout()
show()