Example: standalone_multiplerun
This example shows how to run several, independent simulations in standalone mode.
Given that this example only involves a single neuron, an alternative – and arguably more elegant – solution
would be to run the simulations in a single NeuronGroup, where each neuron receives input with a different rate.
The example is a standalone equivalent of the one presented in /tutorials/3-intro-to-brian-simulations.
import numpy as np
import matplotlib.pyplot as plt
import brian2 as b2
from time import time

b2.set_device('cpp_standalone', build_on_run=False)

if __name__ == "__main__":
    start_time = time()
    num_inputs = 100
    input_rate = 10 * b2.Hz
    weight = 0.1

    net = b2.Network()
    P = b2.PoissonGroup(num_inputs, rates=input_rate)
    eqs = """
    dv/dt = -v/tau : 1
    tau : second (constant)
    """
    G = b2.NeuronGroup(1, eqs, threshold='v>1', reset='v=0', method='euler')
    S = b2.Synapses(P, G, on_pre='v += weight')
    S.connect()
    M = b2.SpikeMonitor(G)
    net.add([P, G, S, M])

    net.run(1000 * b2.ms)

    b2.device.build(run=False)  # compile the code, but don't run it yet

    npoints = 15
    tau_range = np.linspace(1, 15, npoints) * b2.ms

    output_rates = np.zeros(npoints)
    for ii in range(npoints):
        tau_i = tau_range[ii]
        b2.device.run(run_args={G.tau: tau_i})
        output_rates[ii] = M.num_spikes / b2.second

    print(f"Done in {time() - start_time}")

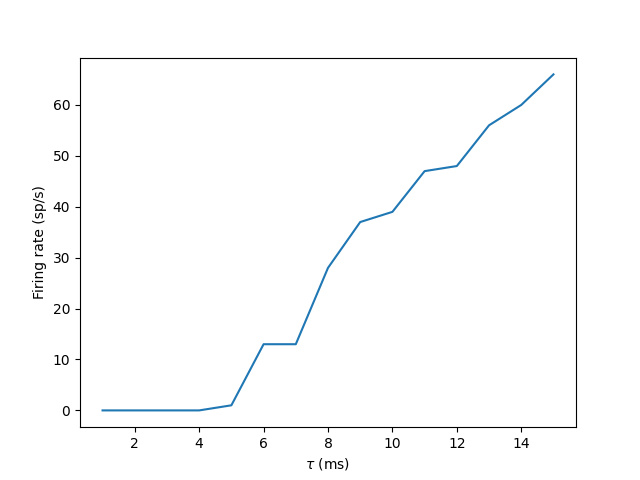
    plt.plot(tau_range/b2.ms, output_rates)
    plt.xlabel(r"$\tau$ (ms)")
    plt.ylabel("Firing rate (sp/s)")
    plt.show()
