Example: Touboul_Brette_2008
Chaos in the AdEx model
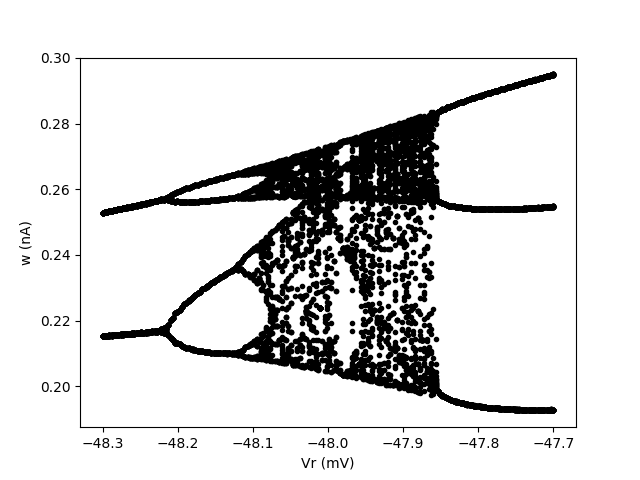
Fig. 8B from: Touboul, J. and Brette, R. (2008). Dynamics and bifurcations of the adaptive exponential integrate-and-fire model. Biological Cybernetics 99(4-5):319-34.
This shows the bifurcation structure when the reset value is varied (vertical axis shows the values of w at spike times for a given a reset value Vr).
from brian2 import *

defaultclock.dt = 0.01*ms

C = 281*pF
gL = 30*nS
EL = -70.6*mV
VT = -50.4*mV
DeltaT = 2*mV
tauw = 40*ms
a = 4*nS
b = 0.08*nA
I = .8*nA
Vcut = VT + 5 * DeltaT  # practical threshold condition
N = 200

eqs = """
dvm/dt=(gL*(EL-vm)+gL*DeltaT*exp((vm-VT)/DeltaT)+I-w)/C : volt
dw/dt=(a*(vm-EL)-w)/tauw : amp
Vr:volt
"""

neuron = NeuronGroup(N, model=eqs, threshold='vm > Vcut',
                     reset="vm = Vr; w += b", method='euler')
neuron.vm = EL
neuron.w = a * (neuron.vm - EL)
neuron.Vr = linspace(-48.3 * mV, -47.7 * mV, N)  # bifurcation parameter

init_time = 3*second
run(init_time, report='text')  # we discard the first spikes

states = StateMonitor(neuron, "w", record=True, when='start')
spikes = SpikeMonitor(neuron)
run(1 * second, report='text')

# Get the values of Vr and w for each spike
Vr = neuron.Vr[spikes.i]
w = states.w[spikes.i, int_((spikes.t-init_time)/defaultclock.dt)]

figure()
plot(Vr / mV, w / nA, '.k')
xlabel('Vr (mV)')
ylabel('w (nA)')
show()
