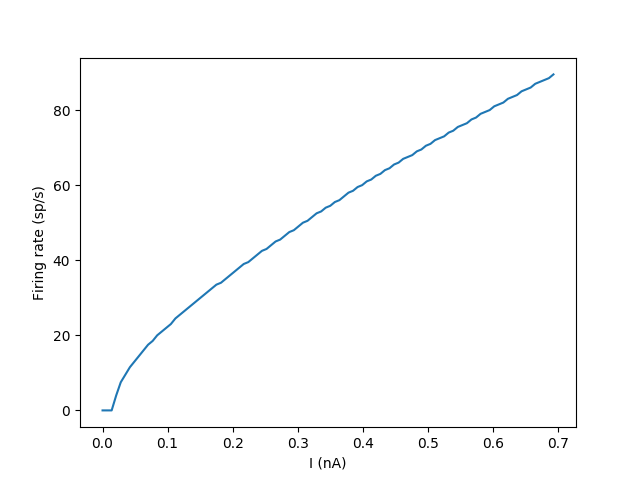
Example: IF_curve_Hodgkin_Huxley
Input-Frequency curve of a HH model.
Network: 100 unconnected Hodgin-Huxley neurons with an input current I. The input is set differently for each neuron.
This simulation should use exponential Euler integration.
from brian2 import *

num_neurons = 100
duration = 2*second

# Parameters
area = 20000*umetre**2
Cm = 1*ufarad*cm**-2 * area
gl = 5e-5*siemens*cm**-2 * area
El = -65*mV
EK = -90*mV
ENa = 50*mV
g_na = 100*msiemens*cm**-2 * area
g_kd = 30*msiemens*cm**-2 * area
VT = -63*mV

# The model
eqs = Equations('''
dv/dt = (gl*(El-v) - g_na*(m*m*m)*h*(v-ENa) - g_kd*(n*n*n*n)*(v-EK) + I)/Cm : volt
dm/dt = 0.32*(mV**-1)*4*mV/exprel((13.*mV-v+VT)/(4*mV))/ms*(1-m)-0.28*(mV**-1)*5*mV/exprel((v-VT-40.*mV)/(5*mV))/ms*m : 1
dn/dt = 0.032*(mV**-1)*5*mV/exprel((15.*mV-v+VT)/(5*mV))/ms*(1.-n)-.5*exp((10.*mV-v+VT)/(40.*mV))/ms*n : 1
dh/dt = 0.128*exp((17.*mV-v+VT)/(18.*mV))/ms*(1.-h)-4./(1+exp((40.*mV-v+VT)/(5.*mV)))/ms*h : 1
I : amp
''')
# Threshold and refractoriness are only used for spike counting
group = NeuronGroup(num_neurons, eqs,
                    threshold='v > -40*mV',
                    refractory='v > -40*mV',
                    method='exponential_euler')
group.v = El
group.I = '0.7*nA * i / num_neurons'

monitor = SpikeMonitor(group)

run(duration)

plot(group.I/nA, monitor.count / duration)
xlabel('I (nA)')
ylabel('Firing rate (sp/s)')
show()
