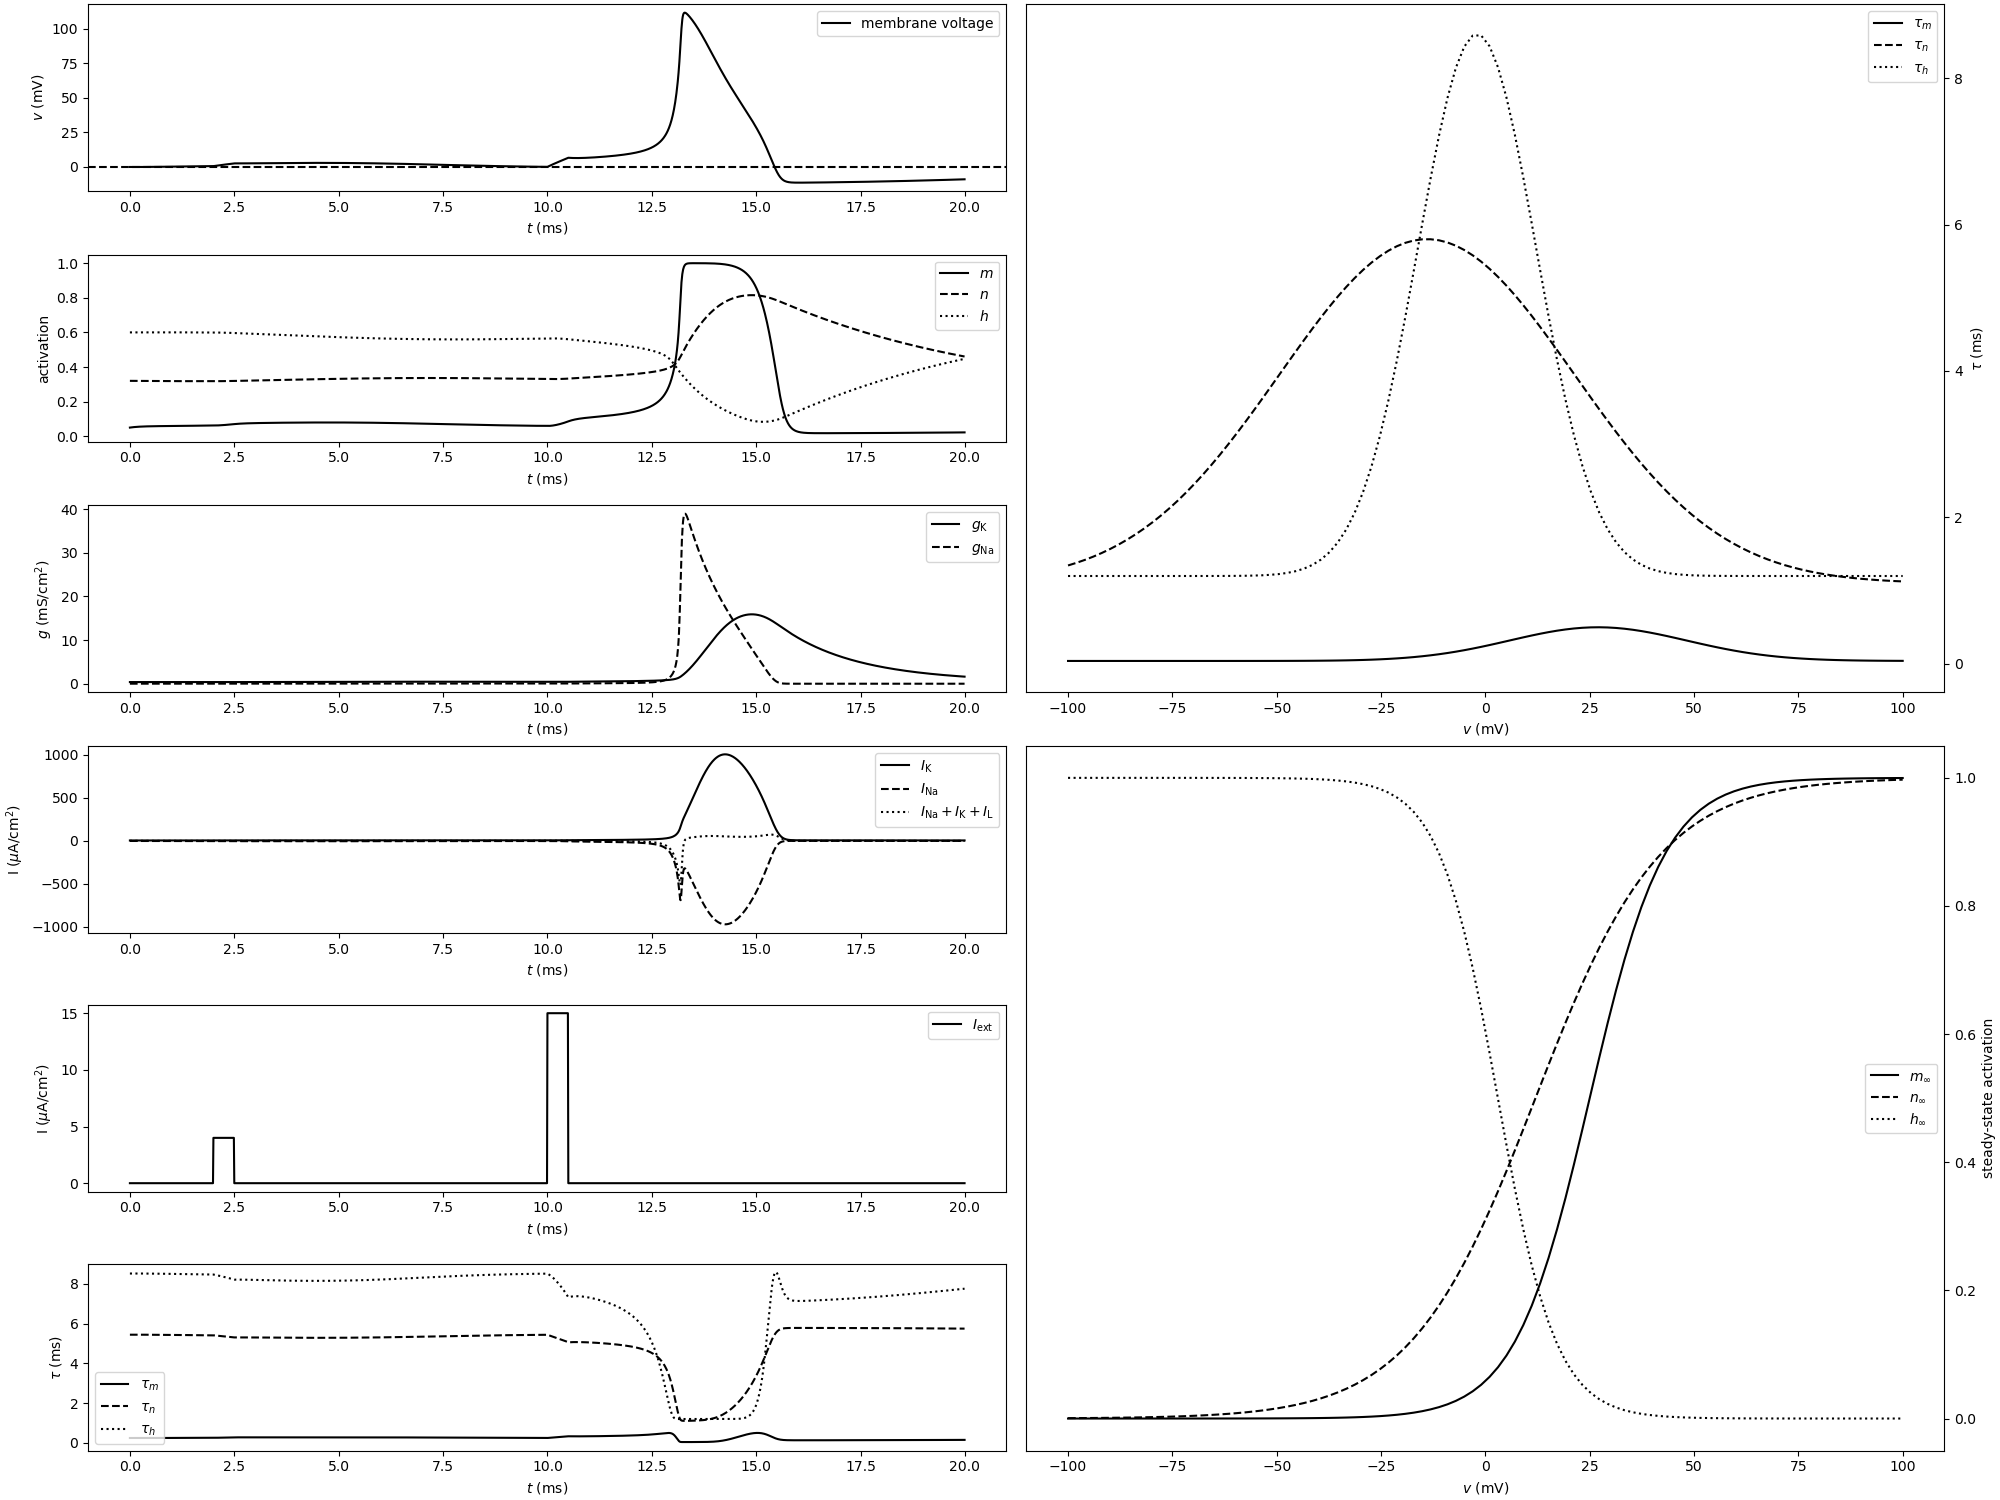
Example: COBAHH_approximated
Follows exercise 4, chapter 2 of Eugene M. Izhikevich: Dynamical Systems in Neuroscience
Sebastian Schmitt, 2021
import argparse
from functools import reduce
import operator

import matplotlib.pyplot as plt
from cycler import cycler
import numpy as np

from brian2 import run
from brian2 import mS, cmeter, ms, mV, uA, uF
from brian2 import Equations, NeuronGroup, StateMonitor, TimedArray, defaultclock


def construct_gating_variable_inf_equation(gating_variable):
    """Construct the voltage-dependent steady-state gating variable equation.

    Approximated by Boltzmann function.

    gating_variable -- gating variable, typically one of "m", "n" and "h"
    """

    return Equations('xinf = 1/(1+exp((v_half-v)/k)) : 1',
                     xinf=f'{gating_variable}_inf',
                     v_half=f'v_{gating_variable}_half',
                     k=f'k_{gating_variable}')


def construct_gating_variable_tau_equation(gating_variable):
    """Construct the voltage-dependent gating variable time constant equation.

    Approximated by Gaussian function.

    gating_variable -- gating variable, typically one of "m", "n" and "h"
    """

    return Equations('tau = c_base + c_amp*exp(-(v_max - v)**2/sigma**2) : second',
                     tau=f'tau_{gating_variable}',
                     c_base=f'c_{gating_variable}_base',
                     c_amp=f'c_{gating_variable}_amp',
                     v_max=f'v_{gating_variable}_max',
                     sigma=f'sigma_{gating_variable}')


def construct_gating_variable_ode(gating_variable):
    """Construct the ordinary differential equation of the gating variable.

    gating_variable -- gating variable, typically one of "m", "n" and "h"
    """

    return Equations('dx/dt = (xinf - x)/tau : 1',
                     x=gating_variable,
                     xinf=f'{gating_variable}_inf',
                     tau=f'tau_{gating_variable}')


def construct_neuron_ode():
    """Construct the ordinary differential equation of the membrane."""

    # conductances
    g_K_eq = Equations('g_K = g_K_bar*n**4 : siemens/meter**2')
    g_Na_eq = Equations('g_Na = g_Na_bar*m**3*h : siemens/meter**2')

    # currents
    I_K_eq = Equations('I_K = g_K*(v - e_K) : ampere/meter**2')
    I_Na_eq = Equations('I_Na = g_Na*(v - e_Na) : ampere/meter**2')
    I_L_eq = Equations('I_L = g_L*(v - e_L) : ampere/meter**2')

    # external drive
    I_ext_eq = Equations('I_ext = I_stim(t) : ampere/meter**2')

    # membrane
    membrane_eq = Equations('dv/dt = (I_ext - I_K - I_Na - I_L)/C_mem : volt')

    return [g_K_eq, g_Na_eq, I_K_eq, I_Na_eq, I_L_eq, I_ext_eq, membrane_eq]


def plot_tau(ax, parameters):
    """Plot gating variable time constants as function of membrane potential.

    ax -- matplotlib axes to be plotted on
    parameters -- dictionary of parameters for gating variable time constant equations
    """

    tau_group = NeuronGroup(100,
                            Equations('v : volt') +
                            reduce(operator.add, [construct_gating_variable_tau_equation(
                                gv) for gv in ['m', 'n', 'h']]),
                            method='euler', namespace=parameters)

    min_v = -100
    max_v = 100
    tau_group.v = np.linspace(min_v, max_v, len(tau_group))*mV

    ax.plot(tau_group.v/mV, tau_group.tau_m/ms, label=r'$\tau_m$')
    ax.plot(tau_group.v/mV, tau_group.tau_n/ms, label=r'$\tau_n$')
    ax.plot(tau_group.v/mV, tau_group.tau_h/ms, label=r'$\tau_h$')

    ax.set_xlabel('$v$ (mV)')
    ax.set_ylabel(r'$\tau$ (ms)')
    ax.yaxis.set_label_position("right")
    ax.yaxis.tick_right()
    ax.legend()


def plot_inf(ax, parameters):
    """Plot gating variable steady-state values as function of membrane potential.

    ax -- matplotlib axes to be plotted on
    parameters -- dictionary of parameters for gating variable steady-state equations
    """

    inf_group = NeuronGroup(100,
                            Equations('v : volt') +
                            reduce(operator.add, [construct_gating_variable_inf_equation(
                                gv) for gv in ['m', 'n', 'h']]),
                            method='euler', namespace=parameters)
    inf_group.v = np.linspace(-100, 100, len(inf_group))*mV

    ax.plot(inf_group.v/mV, inf_group.m_inf, label=r'$m_\infty$')
    ax.plot(inf_group.v/mV, inf_group.n_inf, label=r'$n_\infty$')
    ax.plot(inf_group.v/mV, inf_group.h_inf, label=r'$h_\infty$')
    ax.set_xlabel('$v$ (mV)')
    ax.set_ylabel('steady-state activation')
    ax.yaxis.set_label_position("right")
    ax.yaxis.tick_right()
    ax.legend()


def plot_membrane_voltage(ax, statemon):
    """Plot simulation result: membrane potential.

    ax -- matplotlib axes to be plotted on
    statemon -- StateMonitor (with v recorded)
    """

    ax.plot(statemon.t/ms, statemon.v[0]/mV, label='membrane voltage')
    ax.set_xlabel('$t$ (ms)')
    ax.set_ylabel('$v$ (mV)')
    ax.axhline(0, linestyle='dashed')
    ax.legend()


def plot_gating_variable_activations(ax, statemon):
    """Plot simulation result: gating variables.

    ax -- matplotlib axes to be plotted on
    statemon -- StateMonitor (with m, n and h recorded)
    """

    ax.plot(statemon.t/ms, statemon.m[0], label='$m$')
    ax.plot(statemon.t/ms, statemon.n[0], label='$n$')
    ax.plot(statemon.t/ms, statemon.h[0], label='$h$')
    ax.set_xlabel('$t$ (ms)')
    ax.set_ylabel('activation')
    ax.legend()


def plot_conductances(ax, statemon):
    """Plot simulation result: conductances.

    ax -- matplotlib axes to be plotted on
    statemon -- StateMonitor (with g_K and g_Na recorded)
    """

    ax.plot(statemon.t/ms, statemon.g_K[0] / (mS/(cmeter**2)),
            label=r'$g_\mathregular{K}$')

    ax.plot(statemon.t/ms, statemon.g_Na[0] / (mS/(cmeter**2)),
            label=r'$g_\mathregular{Na}$')

    ax.set_xlabel('$t$ (ms)')
    ax.set_ylabel('$g$ (mS/cm$^2$)')
    ax.legend()


def plot_currents(ax, statemon):
    """Plot simulation result: currents.

    ax -- matplotlib axes to be plotted on
    statemon -- StateMonitor (with I_K, I_Na and I_L recorded)
    """

    ax.plot(statemon.t/ms,
            statemon.I_K[0] / (uA/(cmeter**2)),
            label=r'$I_\mathregular{K}$')

    ax.plot(statemon.t/ms, statemon.I_Na[0] / (uA/(cmeter**2)),
            label=r'$I_\mathregular{Na}$')

    ax.plot(statemon.t/ms, (statemon.I_Na[0] + statemon.I_K[0] +
                            statemon.I_L[0]) / (uA/(cmeter**2)),
            label=r'$I_\mathregular{Na} + I_\mathregular{K} + I_\mathregular{L}$')

    ax.set_xlabel('$t$ (ms)')
    ax.set_ylabel(r'I ($\mu$A/cm$^2$)')
    ax.legend()


def plot_current_stimulus(ax, statemon):
    """Plot simulation result: external current stimulus.

    ax -- matplotlib axes to be plotted on
    statemon -- StateMonitor (with I_ext recorded)
    """

    ax.plot(statemon.t/ms, statemon.I_ext[0] /
            (uA/(cmeter**2)), label=r'$I_\mathregular{ext}$')

    ax.set_xlabel('$t$ (ms)')
    ax.set_ylabel(r'I ($\mu$A/cm$^2$)')
    ax.legend()


def plot_gating_variable_time_constants(ax, statemon):
    """Plot simulation result: gating variable time constants.

    ax -- matplotlib axes to be plotted on
    statemon -- StateMonitor (with tau_m, tau_n and tau_h recorded)
    """

    ax.plot(statemon.t/ms, statemon.tau_m[0]/ms, label=r'$\tau_m$')
    ax.plot(statemon.t/ms, statemon.tau_n[0]/ms, label=r'$\tau_n$')
    ax.plot(statemon.t/ms, statemon.tau_h[0]/ms, label=r'$\tau_h$')

    ax.set_xlabel('$t$ (ms)')
    ax.set_ylabel(r'$\tau$ (ms)')
    ax.legend()


def run_simulation(parameters):
    """Run the simulation.

    parameters -- dictionary with parameters
    """

    equations = []
    for gating_variable in ["m", "n", "h"]:
        equations.append(
            construct_gating_variable_inf_equation(gating_variable))
        equations.append(
            construct_gating_variable_tau_equation(gating_variable))
        equations.append(construct_gating_variable_ode(gating_variable))
    equations += construct_neuron_ode()

    eqs_HH = reduce(operator.add, equations)
    group = NeuronGroup(1, eqs_HH, method='euler', namespace=parameters)

    group.v = parameters["v_initial"]

    group.m = parameters["m_initial"]
    group.n = parameters["n_initial"]
    group.h = parameters["h_initial"]

    statemon = StateMonitor(group, ['v',
                                    'I_ext',
                                    'm', 'n', 'h',
                                    'g_K', 'g_Na',
                                    'I_K', 'I_Na', 'I_L',
                                    'tau_m', 'tau_n', 'tau_h'],
                            record=True)

    defaultclock.dt = parameters["defaultclock_dt"]
    run(parameters["duration"])

    return statemon


def main(parameters):
    """Run simulation and return matplotlib figure.

    parameters -- dictionary with parameters
    """

    statemon = run_simulation(parameters)

    fig = plt.figure(figsize=(20, 15), constrained_layout=True)
    gs = fig.add_gridspec(6, 2)

    ax0 = fig.add_subplot(gs[0, 0])
    ax1 = fig.add_subplot(gs[1, 0])
    ax2 = fig.add_subplot(gs[2, 0])
    ax3 = fig.add_subplot(gs[3, 0])
    ax4 = fig.add_subplot(gs[4, 0])
    ax5 = fig.add_subplot(gs[5, 0])
    ax6 = fig.add_subplot(gs[:3, 1])
    ax7 = fig.add_subplot(gs[3:, 1])

    plot_membrane_voltage(ax0, statemon)
    plot_gating_variable_activations(ax1, statemon)
    plot_conductances(ax2, statemon)
    plot_currents(ax3, statemon)
    plot_current_stimulus(ax4, statemon)
    plot_gating_variable_time_constants(ax5, statemon)

    plot_tau(ax6, parameters)
    plot_inf(ax7, parameters)

    return fig


parameters = {

    # Boltzmann function parameters
    'v_n_half': 12*mV,
    'v_m_half': 25*mV,
    'v_h_half': 3*mV,

    'k_n': 15*mV,
    'k_m': 9*mV,
    'k_h': -7*mV,

    # Gaussian function parameters
    'v_n_max': -14*mV,
    'v_m_max': 27*mV,
    'v_h_max': -2*mV,

    'sigma_n': 50*mV,
    'sigma_m': 30*mV,
    'sigma_h': 20*mV,

    'c_n_amp': 4.7*ms,
    'c_m_amp': 0.46*ms,
    'c_h_amp': 7.4*ms,

    'c_n_base': 1.1*ms,
    'c_m_base': 0.04*ms,
    'c_h_base': 1.2*ms,

    # conductances
    'g_K_bar': 36*mS / (cmeter**2),
    'g_Na_bar': 120*mS / (cmeter**2),
    'g_L': 0.3*mS / (cmeter**2),

    # reversal potentials
    'e_K': -12*mV,
    'e_Na': 120*mV,
    'e_L': 10.6*mV,

    # membrane capacitance
    'C_mem': 1*uF / cmeter**2,

    # initial membrane voltage
    'v_initial': 0*mV,

    # initial gating variable activations
    'm_initial': 0.05,
    'n_initial': 0.32,
    'h_initial': 0.60,

    # external stimulus at 2 ms with 4 uA/cm^2 and at 10 ms with 15 uA/cm^2
    # for 0.5 ms each
    'I_stim': TimedArray(values=([0]*4+[4]+[0]*15+[15]+[0])*uA/(cmeter**2),
                         dt=0.5*ms),

    # simulation time step
    'defaultclock_dt': 0.01*ms,

    # simulation duration
    'duration': 20*ms
}

linestyle_cycler = cycler('linestyle',['-','--',':','-.'])
plt.rc('axes', prop_cycle=linestyle_cycler)

fig = main(parameters)

plt.show()
