Example: Destexhe_et_al_1998
Note
You can launch an interactive, editable version of this example without installing any local files using the Binder service (although note that at some times this may be slow or fail to open):
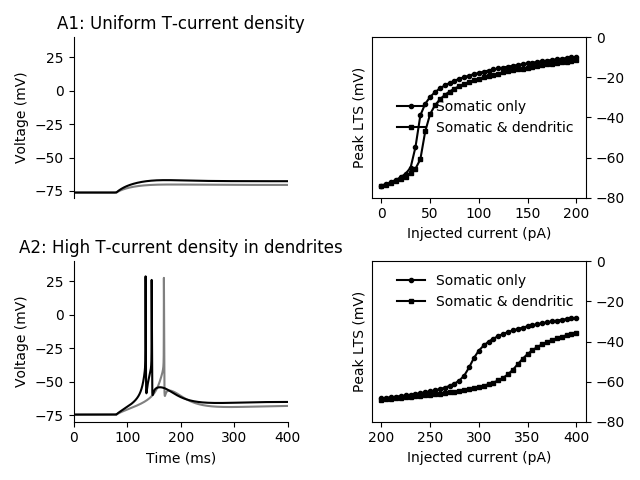
Reproduces Figure 12 (simplified three-compartment model) from the following paper:
Dendritic Low-Threshold Calcium Currents in Thalamic Relay Cells Alain Destexhe, Mike Neubig, Daniel Ulrich, John Huguenard Journal of Neuroscience 15 May 1998, 18 (10) 3574-3588
The original NEURON code is available on ModelDB: https://senselab.med.yale.edu/modeldb/ShowModel.cshtml?model=279
Reference for the original morphology:
Rat VB neuron (thalamocortical cell), given by J. Huguenard, stained with biocytin and traced by A. Destexhe, December 1992. The neuron is described in: J.R. Huguenard & D.A. Prince, A novel T-type current underlies prolonged calcium-dependent burst firing in GABAergic neurons of rat thalamic reticular nucleus. J. Neurosci. 12: 3804-3817, 1992.
Available at NeuroMorpho.org:
http://neuromorpho.org/neuron_info.jsp?neuron_name=tc200 NeuroMorpho.Org ID :NMO_00881
Notes
Completely removed the “Fast mechanism for submembranal Ca++ concentration (cai)” – it did not affect the results presented here
Time constants for the I_T current are slightly different from the equations given in the paper – the paper calculation seems to be based on 36 degree Celsius but the temperature that is used is 34 degrees.
To reproduce Figure 12C, the “presence of dendritic shunt conductances” meant setting g_L to 0.15 mS/cm^2 for the whole neuron.
Other small discrepancies with the paper – values from the NEURON code were used whenever different from the values stated in the paper
from brian2 import *
from brian2.units.constants import (zero_celsius, faraday_constant as F,
                                    gas_constant as R)

defaultclock.dt = 0.01*ms

VT = -52*mV
El = -76.5*mV  # from code, text says: -69.85*mV

E_Na = 50*mV
E_K = -100*mV
C_d = 7.954  # dendritic correction factor

T = 34*kelvin + zero_celsius # 34 degC (current-clamp experiments)
tadj_HH = 3.0**((34-36)/10.0)  # temperature adjustment for Na & K (original recordings at 36 degC)
tadj_m_T = 2.5**((34-24)/10.0)
tadj_h_T = 2.5**((34-24)/10.0)

shift_I_T = -1*mV

gamma = F/(R*T)  # R=gas constant, F=Faraday constant
Z_Ca = 2  # Valence of Calcium ions
Ca_i = 240*nM  # intracellular Calcium concentration
Ca_o = 2*mM  # extracellular Calcium concentration

eqs = Equations('''
Im = gl*(El-v) - I_Na - I_K - I_T: amp/meter**2
I_inj : amp (point current)
gl : siemens/meter**2

# HH-type currents for spike initiation
g_Na : siemens/meter**2
g_K : siemens/meter**2
I_Na = g_Na * m**3 * h * (v-E_Na) : amp/meter**2
I_K = g_K * n**4 * (v-E_K) : amp/meter**2
v2 = v - VT : volt  # shifted membrane potential (Traub convention)
dm/dt = (0.32*(mV**-1)*(13.*mV-v2)/
        (exp((13.*mV-v2)/(4.*mV))-1.)*(1-m)-0.28*(mV**-1)*(v2-40.*mV)/
        (exp((v2-40.*mV)/(5.*mV))-1.)*m) / ms * tadj_HH: 1
dn/dt = (0.032*(mV**-1)*(15.*mV-v2)/
        (exp((15.*mV-v2)/(5.*mV))-1.)*(1.-n)-.5*exp((10.*mV-v2)/(40.*mV))*n) / ms * tadj_HH: 1
dh/dt = (0.128*exp((17.*mV-v2)/(18.*mV))*(1.-h)-4./(1+exp((40.*mV-v2)/(5.*mV)))*h) / ms * tadj_HH: 1

# Low-threshold Calcium current (I_T)  -- nonlinear function of voltage
I_T = P_Ca * m_T**2*h_T * G_Ca : amp/meter**2
P_Ca : meter/second  # maximum Permeability to Calcium
G_Ca = Z_Ca**2*F*v*gamma*(Ca_i - Ca_o*exp(-Z_Ca*gamma*v))/(1 - exp(-Z_Ca*gamma*v)) : coulomb/meter**3
dm_T/dt = -(m_T - m_T_inf)/tau_m_T : 1
dh_T/dt = -(h_T - h_T_inf)/tau_h_T : 1
m_T_inf = 1/(1 + exp(-(v/mV + 56)/6.2)) : 1
h_T_inf = 1/(1 + exp((v/mV + 80)/4)) : 1
tau_m_T = (0.612 + 1.0/(exp(-(v/mV + 131)/16.7) + exp((v/mV + 15.8)/18.2))) * ms / tadj_m_T: second
tau_h_T = (int(v<-81*mV) * exp((v/mV + 466)/66.6) +
           int(v>=-81*mV) * (28 + exp(-(v/mV + 21)/10.5))) * ms / tadj_h_T: second
''')

# Simplified three-compartment morphology
morpho = Cylinder(x=[0, 38.42]*um, diameter=26*um)
morpho.dend = Cylinder(x=[0, 12.49]*um, diameter=10.28*um)
morpho.dend.distal = Cylinder(x=[0, 84.67]*um, diameter=8.5*um)
neuron = SpatialNeuron(morpho, eqs, Cm=0.88*uF/cm**2, Ri=173*ohm*cm,
                       method='exponential_euler')

neuron.v = -74*mV
# Only the soma has Na/K channels
neuron.main.g_Na = 100*msiemens/cm**2
neuron.main.g_K = 100*msiemens/cm**2
# Apply the correction factor to the dendrites

neuron.dend.Cm *= C_d
neuron.m_T = 'm_T_inf'
neuron.h_T = 'h_T_inf'

mon = StateMonitor(neuron, ['v'], record=True)

store('initial state')


def do_experiment(currents, somatic_density, dendritic_density,
                  dendritic_conductance=0.0379*msiemens/cm**2,
                  HH_currents=True):
    restore('initial state')
    voltages = []
    neuron.P_Ca = somatic_density
    neuron.dend.distal.P_Ca = dendritic_density * C_d
    # dendritic conductance (shunting conductance used for Fig 12C)
    neuron.gl = dendritic_conductance
    neuron.dend.gl = dendritic_conductance * C_d
    if not HH_currents:
        # Shut off spiking (for Figures 12B and 12C)
        neuron.g_Na = 0*msiemens/cm**2
        neuron.g_K = 0*msiemens/cm**2
    run(180*ms)
    store('before current')
    for current in currents:
        restore('before current')
        neuron.main.I_inj = current
        print('.', end='')
        run(320*ms)
        voltages.append(mon[morpho].v[:])  # somatic voltage
    return voltages


## Run the various variants of the model to reproduce Figure 12
mpl.rcParams['lines.markersize'] = 3.0
fig, axes = plt.subplots(2, 2)
print('Running experiments for Figure A1 ', end='')
voltages = do_experiment([50, 75]*pA, somatic_density=1.7e-5*cm/second,
                         dendritic_density=1.7e-5*cm/second)
print(' done.')
cut_off = 100*ms  # Do not display first part of simulation
axes[0, 0].plot((mon.t - cut_off) / ms, voltages[0] / mV, color='gray')
axes[0, 0].plot((mon.t - cut_off) / ms, voltages[1] / mV, color='black')
axes[0, 0].set(xlim=(0, 400), ylim=(-80, 40), xticks=[],
               title='A1: Uniform T-current density', ylabel='Voltage (mV)')
axes[0, 0].spines['right'].set_visible(False)
axes[0, 0].spines['top'].set_visible(False)
axes[0, 0].spines['bottom'].set_visible(False)

print('Running experiments for Figure A2 ', end='')
voltages = do_experiment([50, 75]*pA, somatic_density=1.7e-5*cm/second,
                         dendritic_density=9.5e-5*cm/second)
print(' done.')
cut_off = 100*ms  # Do not display first part of simulation
axes[1, 0].plot((mon.t - cut_off) / ms, voltages[0] / mV, color='gray')
axes[1, 0].plot((mon.t - cut_off) / ms, voltages[1] / mV, color='black')
axes[1, 0].set(xlim=(0, 400), ylim=(-80, 40),
               title='A2: High T-current density in dendrites',
               xlabel='Time (ms)', ylabel='Voltage (mV)')
axes[1, 0].spines['right'].set_visible(False)
axes[1, 0].spines['top'].set_visible(False)

print('Running experiments for Figure B ', end='')
currents = np.linspace(0, 200, 41)*pA
voltages_somatic = do_experiment(currents, somatic_density=56.36e-5*cm/second,
                                 dendritic_density=0*cm/second,
                                 HH_currents=False)
voltages_somatic_dendritic = do_experiment(currents, somatic_density=1.7e-5*cm/second,
                                           dendritic_density=9.5e-5*cm/second,
                                           HH_currents=False)
print(' done.')
maxima_somatic = Quantity(voltages_somatic).max(axis=1)
maxima_somatic_dendritic = Quantity(voltages_somatic_dendritic).max(axis=1)
axes[0, 1].yaxis.tick_right()
axes[0, 1].plot(currents/pA, maxima_somatic/mV,
                'o-', color='black', label='Somatic only')
axes[0, 1].plot(currents/pA, maxima_somatic_dendritic/mV,
                's-', color='black', label='Somatic & dendritic')
axes[0, 1].set(xlabel='Injected current (pA)', ylabel='Peak LTS (mV)',
               ylim=(-80, 0))
axes[0, 1].legend(loc='best', frameon=False)

print('Running experiments for Figure C ', end='')
currents = np.linspace(200, 400, 41)*pA
voltages_somatic = do_experiment(currents, somatic_density=56.36e-5*cm/second,
                                 dendritic_density=0*cm/second,
                                 dendritic_conductance=0.15*msiemens/cm**2,
                                 HH_currents=False)
voltages_somatic_dendritic = do_experiment(currents, somatic_density=1.7e-5*cm/second,
                                           dendritic_density=9.5e-5*cm/second,
                                           dendritic_conductance=0.15*msiemens/cm**2,
                                           HH_currents=False)
print(' done.')
maxima_somatic = Quantity(voltages_somatic).max(axis=1)
maxima_somatic_dendritic = Quantity(voltages_somatic_dendritic).max(axis=1)
axes[1, 1].yaxis.tick_right()
axes[1, 1].plot(currents/pA, maxima_somatic/mV,
                'o-', color='black', label='Somatic only')
axes[1, 1].plot(currents/pA, maxima_somatic_dendritic/mV,
                's-', color='black', label='Somatic & dendritic')
axes[1, 1].set(xlabel='Injected current (pA)', ylabel='Peak LTS (mV)',
               ylim=(-80, 0))
axes[1, 1].legend(loc='best', frameon=False)

plt.tight_layout()
plt.show()