Example: stochastic_odes
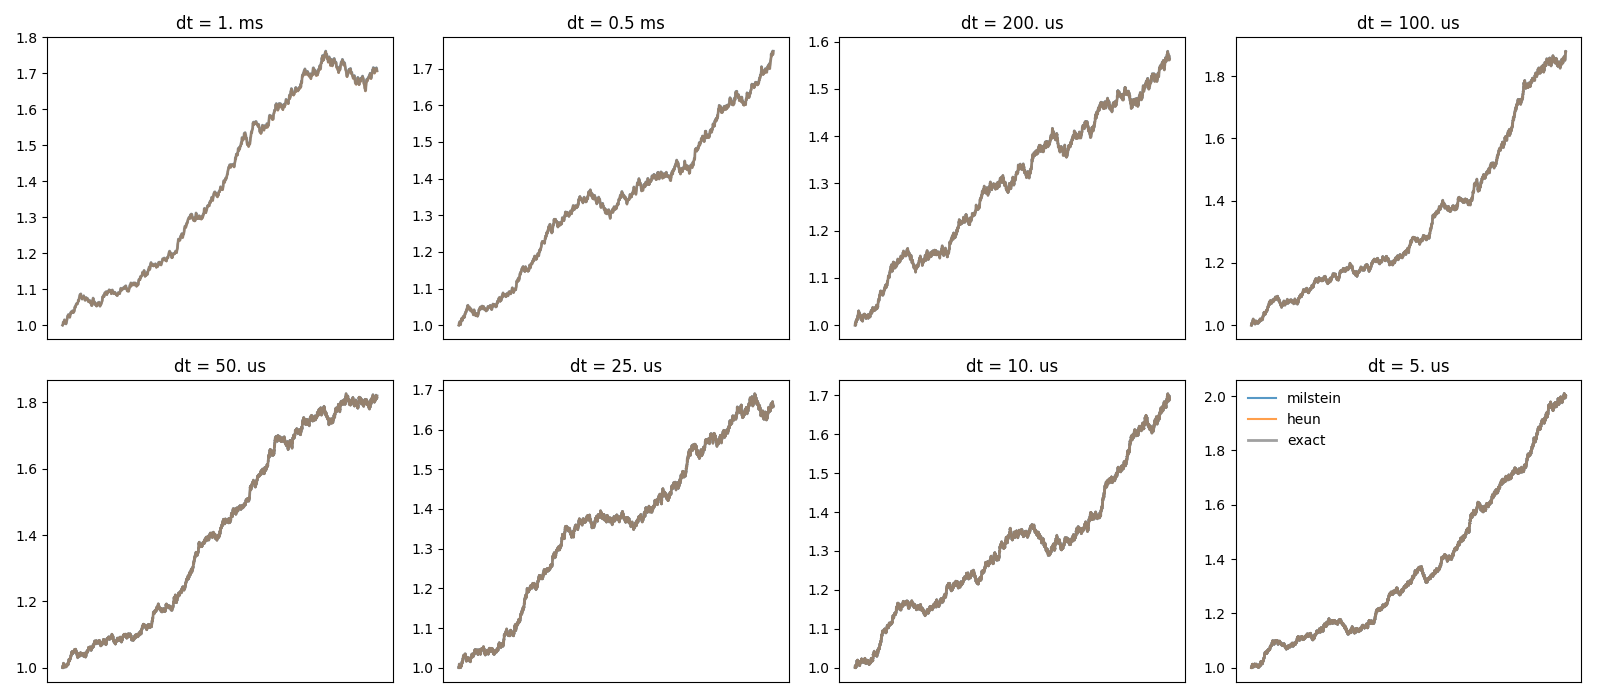
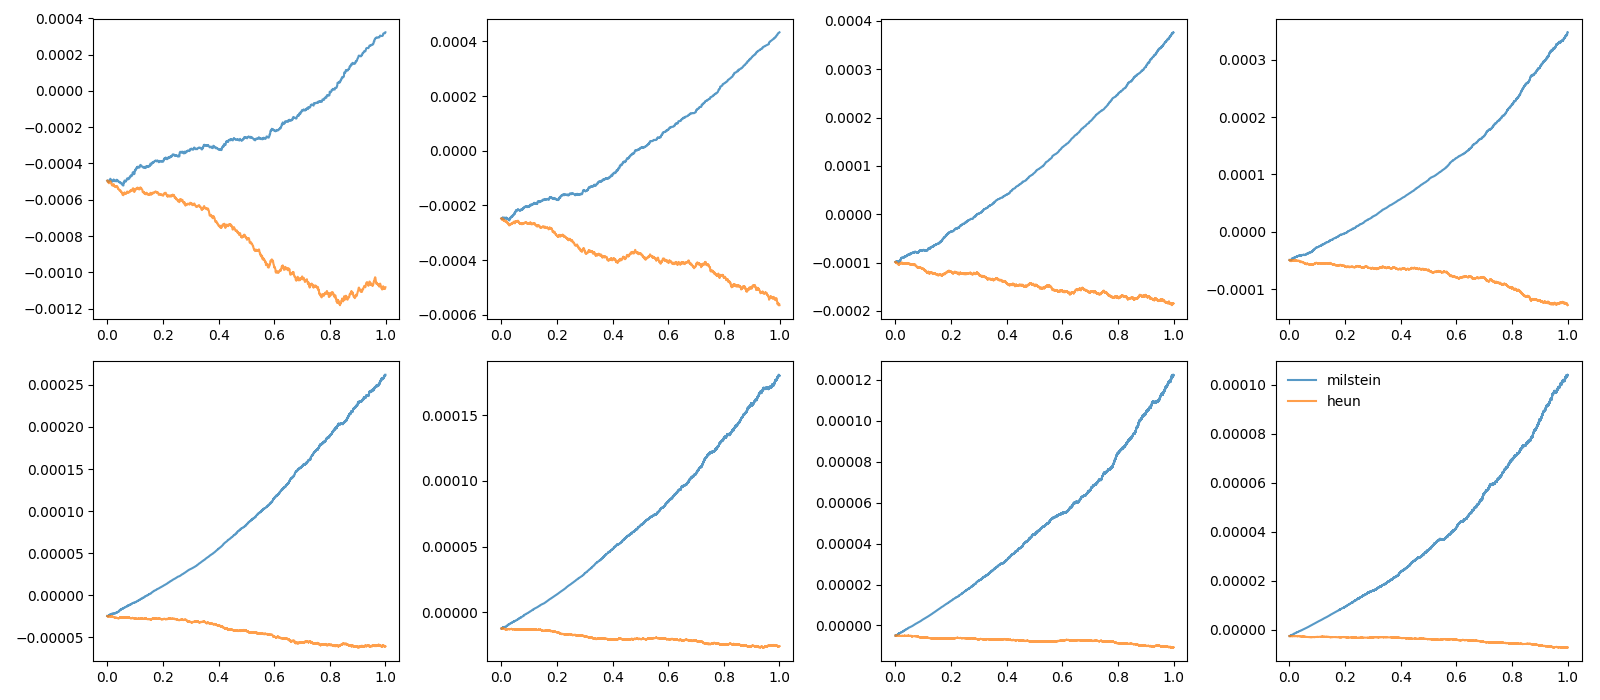
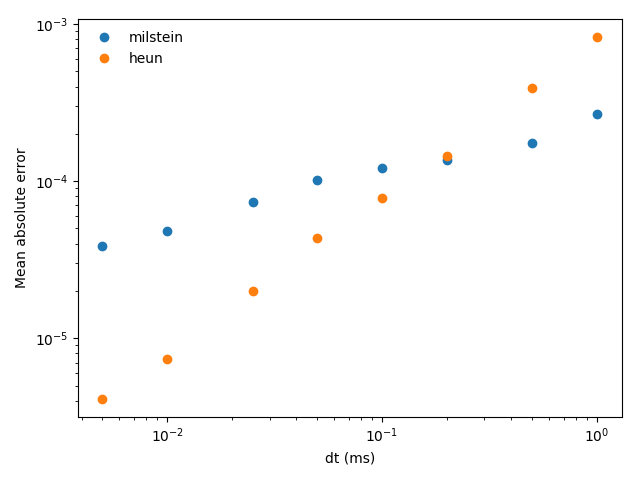
Demonstrate the correctness of the “derivative-free Milstein method” for multiplicative noise.
from brian2 import *
# We only get exactly the same random numbers for the exact solution and the
# simulation if we use the numpy code generation target
prefs.codegen.target = 'numpy'

# setting a random seed makes all variants use exactly the same Wiener process
seed = 12347

X0 = 1
mu = 0.5/second # drift
sigma = 0.1/second #diffusion

runtime = 1*second


def simulate(method, dt):
    """
    simulate geometrical Brownian with the given method
    """
    np.random.seed(seed)
    G = NeuronGroup(1, 'dX/dt = (mu - 0.5*second*sigma**2)*X + X*sigma*xi*second**.5: 1',
                    dt=dt, method=method)
    G.X = X0
    mon = StateMonitor(G, 'X', record=True)
    net = Network(G, mon)
    net.run(runtime)
    return mon.t_[:], mon.X.flatten()


def exact_solution(t, dt):
    """
    Return the exact solution for geometrical Brownian motion at the given
    time points
    """
    # Remove units for simplicity
    my_mu = float(mu)
    my_sigma = float(sigma)
    dt = float(dt)
    t = asarray(t)

    np.random.seed(seed)
    # We are calculating the values at the *start* of a time step, as when using
    # a StateMonitor. Therefore the Brownian motion starts with zero
    brownian = np.hstack([0, cumsum(sqrt(dt) * np.random.randn(len(t)-1))])

    return (X0 * exp((my_mu - 0.5*my_sigma**2)*(t+dt) + my_sigma*brownian))

figure(1, figsize=(16, 7))
figure(2, figsize=(16, 7))

methods = ['milstein', 'heun']
dts = [1*ms, 0.5*ms, 0.2*ms, 0.1*ms, 0.05*ms, 0.025*ms, 0.01*ms, 0.005*ms]

rows = floor(sqrt(len(dts)))
cols = ceil(1.0 * len(dts) / rows)
errors = dict([(method, zeros(len(dts))) for method in methods])
for dt_idx, dt in enumerate(dts):
    print('dt: %s' % dt)
    trajectories = {}
    # Test the numerical methods
    for method in methods:
        t, trajectories[method] = simulate(method, dt)
    # Calculate the exact solution
    exact = exact_solution(t, dt)

    for method in methods:
        # plot the trajectories
        figure(1)
        subplot(rows, cols, dt_idx+1)
        plot(t, trajectories[method], label=method, alpha=0.75)

        # determine the mean absolute error
        errors[method][dt_idx] = mean(abs(trajectories[method] - exact))
        # plot the difference to the real trajectory
        figure(2)
        subplot(rows, cols, dt_idx+1)
        plot(t, trajectories[method] - exact, label=method, alpha=0.75)

    figure(1)
    plot(t, exact, color='gray', lw=2, label='exact', alpha=0.75)
    title('dt = %s' % str(dt))
    xticks([])

figure(1)
legend(frameon=False, loc='best')
tight_layout()

figure(2)
legend(frameon=False, loc='best')
tight_layout()

figure(3)
for method in methods:
    plot(array(dts) / ms, errors[method], 'o', label=method)
legend(frameon=False, loc='best')
xscale('log')
yscale('log')
xlabel('dt (ms)')
ylabel('Mean absolute error')
tight_layout()

show()


