Example: custom_events
Note
You can launch an interactive, editable version of this example without installing any local files using the Binder service (although note that at some times this may be slow or fail to open):
Example demonstrating the use of custom events.
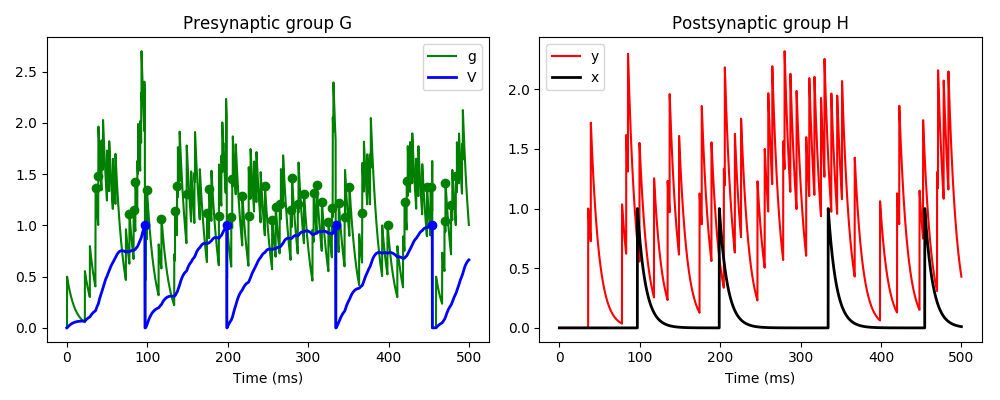
Here we have three neurons, the first is Poisson spiking and connects to neuron G,
which in turn connects to neuron H. Neuron G has two variables v and g, and the
incoming Poisson spikes cause an instantaneous increase in variable g. g decays
rapidly, and in turn causes a slow increase in v. If v crosses a threshold, it
causes a standard spike and reset. If g crosses a threshold, it causes a custom
event gspike, and if it returns below that threshold it causes a custom
event end_gspike. The standard spike event when v crosses a threshold
causes an instantaneous increase in variable x in neuron H (which happens
through the standard pre pathway in the synapses), and the gspike
event causes an increase in variable y (which happens through the custom
pathway gpath).
from brian2 import *
# Input Poisson spikes
inp = PoissonGroup(1, rates=250*Hz)
# First group G
eqs_G = '''
dv/dt = (g-v)/(50*ms) : 1
dg/dt = -g/(10*ms) : 1
allow_gspike : boolean
'''
G = NeuronGroup(1, eqs_G, threshold='v>1',
                reset='v = 0; g = 0; allow_gspike = True;',
                events={'gspike': 'g>1 and allow_gspike',
                        'end_gspike': 'g<1 and not allow_gspike'})
G.run_on_event('gspike', 'allow_gspike = False')
G.run_on_event('end_gspike', 'allow_gspike = True')
# Second group H
eqs_H = '''
dx/dt = -x/(10*ms) : 1
dy/dt = -y/(10*ms) : 1
'''
H = NeuronGroup(1, eqs_H)
# Synapses from input Poisson group to G
Sin = Synapses(inp, G, on_pre='g += 0.5')
Sin.connect()
# Synapses from G to H
S = Synapses(G, H,
             on_pre={'pre': 'x += 1',
                     'gpath': 'y += 1'},
             on_event={'pre': 'spike',
                       'gpath': 'gspike'})
S.connect()
# Monitors
Mstate = StateMonitor(G, ('v', 'g'), record=True)
Mgspike = EventMonitor(G, 'gspike', 'g')
Mspike = SpikeMonitor(G, 'v')
MHstate = StateMonitor(H, ('x', 'y'), record=True)
# Initialise and run
G.allow_gspike = True
run(500*ms)
# Plot
figure(figsize=(10, 4))
subplot(121)
plot(Mstate.t/ms, Mstate.g[0], '-g', label='g')
plot(Mstate.t/ms, Mstate.v[0], '-b', lw=2, label='V')
plot(Mspike.t/ms, Mspike.v, 'ob', label='_nolegend_')
plot(Mgspike.t/ms, Mgspike.g, 'og', label='_nolegend_')
xlabel('Time (ms)')
title('Presynaptic group G')
legend(loc='best')
subplot(122)
plot(MHstate.t/ms, MHstate.y[0], '-r', label='y')
plot(MHstate.t/ms, MHstate.x[0], '-k', lw=2, label='x')
xlabel('Time (ms)')
title('Postsynaptic group H')
legend(loc='best')
tight_layout()
show()