How to plot functions
Models of synapses and neurons are typically composed of a series of functions. To affirm their correct implementation a plot is often helpful.
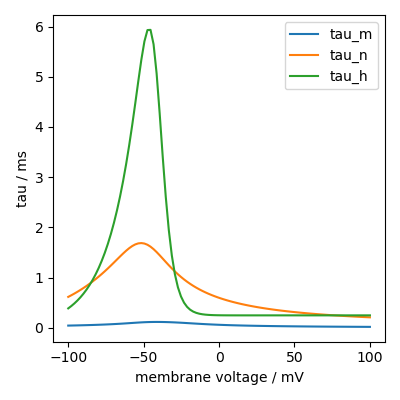
Consider the following membrane voltage dependent Hodgkin-Huxley equations:
from brian2 import *

VT = -63*mV

eq = Equations("""
alpha_m = 0.32*(mV**-1)*4*mV/exprel((13*mV-v+VT)/(4*mV))/ms : Hz
beta_m = 0.28*(mV**-1)*5*mV/exprel((v-VT-40*mV)/(5*mV))/ms : Hz
alpha_h = 0.128*exp((17*mV-v+VT)/(18*mV))/ms : Hz
beta_h = 4./(1+exp((40*mV-v+VT)/(5*mV)))/ms : Hz
alpha_n = 0.032*(mV**-1)*5*mV/exprel((15*mV-v+VT)/(5*mV))/ms : Hz
beta_n = .5*exp((10*mV-v+VT)/(40*mV))/ms : Hz
tau_n = 1/(alpha_n + beta_n) : second
tau_m = 1/(alpha_m + beta_m) : second
tau_h = 1/(alpha_h + beta_h) : second
""")
We can do the following to plot them as function of membrane voltage:
group = NeuronGroup(100, eq + Equations("v : volt"))
group.v = np.linspace(-100, 100, len(group))*mV

plt.plot(group.v/mV, group.tau_m[:]/ms, label="tau_m")
plt.plot(group.v/mV, group.tau_n[:]/ms, label="tau_n")
plt.plot(group.v/mV, group.tau_h[:]/ms, label="tau_h")
plt.xlabel('membrane voltage / mV')
plt.ylabel('tau / ms')
plt.legend()
Note that we need to use [:] for the tau_... equations, because Brian cannot
resolve the external constant VT otherwise. Alternatively we could have supplied
the constant in the namespace of the NeuronGroup, see Namespaces.